

50
4.4.1.1 Procedure
1. The soil thermometer be inserted into the
soil up to a certain depth (c 3″) at the study
point.
2. It is required to wait for c 1 min till the alcohol/mercury within the thermometer becomes
steady.
3. The soil temperature be recorded from the dial
of the thermometer.
4. The temperature be recorded at different study
points.
NB: The thermometer be not pressed too
hard into the soil.
5. In the case of bottom soil in a water body, the
thermometer is inserted into the collected soil
immediately after collection and the temperature is recorded.
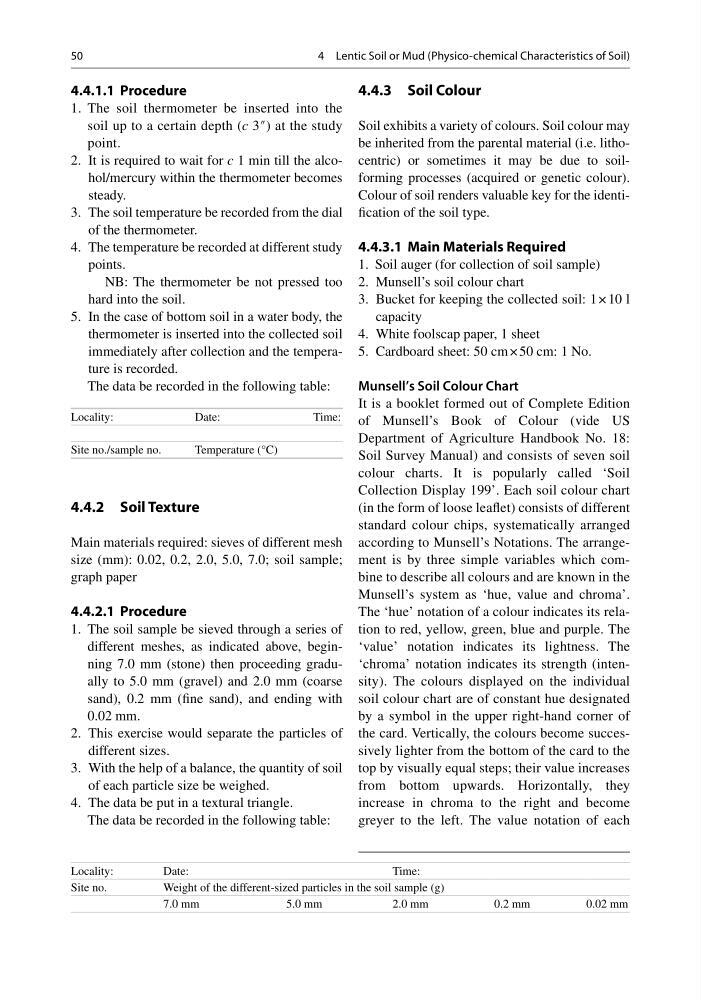
The data be recorded in the following table:
Locality:
Date:
Time:
Site no./sample no.
Temperature (°C)
4.4.2 Soil Texture
Main materials required: sieves of different mesh
size (mm): 0.02, 0.2, 2.0, 5.0, 7.0; soil sample;
graph paper
4.4.2.1 Procedure
1. The soil sample be sieved through a series of
different meshes, as indicated above, beginning 7.0 mm (stone) then proceeding gradually to 5.0 mm (gravel) and 2.0 mm (coarse
sand), 0.2 mm (fine sand), and ending with
0.02 mm.
2. This exercise would separate the particles of
different sizes.
3. With the help of a balance, the quantity of soil
of each particle size be weighed.
4. The data be put in a textural triangle.
The data be recorded in the following table:
4.4.3 Soil Colour
Soil exhibits a variety of colours. Soil colour may
be inherited from the parental material (i.e. lithocentric) or sometimes it may be due to soilforming processes (acquired or genetic colour).
Colour of soil renders valuable key for the identification of the soil type.
4.4.3.1 Main Materials Required
1. Soil auger (for collection of soil sample)
2. Munsell’s soil colour chart
3. Bucket for keeping the collected soil: 1 × 10 l
capacity
4. White foolscap paper, 1 sheet
5. Cardboard sheet: 50 cm × 50 cm: 1 No.
Munsell’s Soil Colour Chart
It is a booklet formed out of Complete Edition
of Munsell’s Book of Colour (vide US
Department of Agriculture Handbook No. 18:
Soil Survey Manual) and consists of seven soil
colour charts. It is popularly called ‘Soil
Collection Display 199’. Each soil colour chart
(in the form of loose leaflet) consists of different
standard colour chips, systematically arranged
according to Munsell’s Notations. The arrangement is by three simple variables which combine to describe all colours and are known in the
Munsell’s system as ‘hue, value and chroma’.
The ‘hue’ notation of a colour indicates its relation to red, yellow, green, blue and purple. The
‘value’ notation indicates its lightness. The
‘chroma’ notation indicates its strength (intensity). The colours displayed on the individual
soil colour chart are of constant hue designated
by a symbol in the upper right-hand corner of
the card. Vertically, the colours become successively lighter from the bottom of the card to the
top by visually equal steps; their value increases
from bottom upwards. Horizontally, they
increase in chroma to the right and become
greyer to the left. The value notation of each
Locality:
Date:
Time:
Site no.
Weight of the different-sized particles in the soil sample (g)
7.0 mm
5.0 mm
2.0 mm
0.2 mm
0.02 mm
4 Lentic Soil or Mud (Physico-chemical Characteristics of Soil)
4.4.1.1 Procedure
1. The soil thermometer be inserted into the
soil up to a certain depth (c 3″) at the study
point.
2. It is required to wait for c 1 min till the alcohol/mercury within the thermometer becomes
steady.
3. The soil temperature be recorded from the dial
of the thermometer.
4. The temperature be recorded at different study
points.
NB: The thermometer be not pressed too
hard into the soil.
5. In the case of bottom soil in a water body, the
thermometer is inserted into the collected soil
immediately after collection and the temperature is recorded.
The data be recorded in the following table:
Locality:
Date:
Time:
Site no./sample no.
Temperature (°C)
4.4.2 Soil Texture
Main materials required: sieves of different mesh
size (mm): 0.02, 0.2, 2.0, 5.0, 7.0; soil sample;
graph paper
4.4.2.1 Procedure
1. The soil sample be sieved through a series of
different meshes, as indicated above, beginning 7.0 mm (stone) then proceeding gradually to 5.0 mm (gravel) and 2.0 mm (coarse
sand), 0.2 mm (fine sand), and ending with
0.02 mm.
2. This exercise would separate the particles of
different sizes.
3. With the help of a balance, the quantity of soil
of each particle size be weighed.
4. The data be put in a textural triangle.
The data be recorded in the following table:
4.4.3 Soil Colour
Soil exhibits a variety of colours. Soil colour may
be inherited from the parental material (i.e. lithocentric) or sometimes it may be due to soilforming processes (acquired or genetic colour).
Colour of soil renders valuable key for the identification of the soil type.
4.4.3.1 Main Materials Required
1. Soil auger (for collection of soil sample)
2. Munsell’s soil colour chart
3. Bucket for keeping the collected soil: 1 × 10 l
capacity
4. White foolscap paper, 1 sheet
5. Cardboard sheet: 50 cm × 50 cm: 1 No.
Munsell’s Soil Colour Chart
It is a booklet formed out of Complete Edition
of Munsell’s Book of Colour (vide US
Department of Agriculture Handbook No. 18:
Soil Survey Manual) and consists of seven soil
colour charts. It is popularly called ‘Soil
Collection Display 199’. Each soil colour chart
(in the form of loose leaflet) consists of different
standard colour chips, systematically arranged
according to Munsell’s Notations. The arrangement is by three simple variables which combine to describe all colours and are known in the
Munsell’s system as ‘hue, value and chroma’.
The ‘hue’ notation of a colour indicates its relation to red, yellow, green, blue and purple. The
‘value’ notation indicates its lightness. The
‘chroma’ notation indicates its strength (intensity). The colours displayed on the individual
soil colour chart are of constant hue designated
by a symbol in the upper right-hand corner of
the card. Vertically, the colours become successively lighter from the bottom of the card to the
top by visually equal steps; their value increases
from bottom upwards. Horizontally, they
increase in chroma to the right and become
greyer to the left. The value notation of each
Locality:
Date:
Time:
Site no.
Weight of the different-sized particles in the soil sample (g)
7.0 mm
5.0 mm
2.0 mm
0.2 mm
0.02 mm
4 Lentic Soil or Mud (Physico-chemical Characteristics of Soil)