

438
the winter months, leaving only patches of water
in the central parts of the Beel.
The Beel is an extensive lowland area in the
lower Atari basin and spreads across Singra and
Gurdaspur upazilas in Natore District. It also
extends to Chatmohar, Bhanga and Faridpur
upazilas of Pabna District, and Ullahpara, Raiganj
and Tarash upazilas of Sirajganj District.
21.1.2.1 History
The main volume of water from the river Ganges
began to fl ow through the Padma channel in the
sixteenth century. Silt from the River Padma,
probably, built up the southern portion of
Northern Bengal. Moreover, the Teesta was
active in the region until it changed its course in
1787. This region lies in between the land raised
in the north by the Teesta system (when it was
active) and that in the south by the Padma.
21.1.2.2 Impact of Railways
Estimate of 1945 revealed that River Atari along
with 46 other rivers were the primary infl ows
into Chalan Beel. The Beel also served as the
origin of many rivers fl owing south or east, which
eventually met the Padma or Jamuna (River
Brahmaputra in India). The total watershed was
estimated to be of about 401,000 ha. In the early
1900s, interference in the Chalan Beel began
with the construction of the East Bengal Railway
main line on the west side of the Beel and the
Santahar–Bogra branch line on the north. The
fl ow of the natural drainages in this area was,
thus, obstructed by the railway embankments.
Consequently, the area of Chalan Beel had been
diminishing (due to fast siltation) from about
1,085 km
2 (108,500 ha) to 368 km
2 (36,800 ha)
in 1909 (of which only 85 km
2 or 8,500 ha
remained underwater throughout the year) and
then to only 26 km
2 (2,600 ha). Today, the Beel
has a surface area of 26 km
2 (10 mile
2 or
2,600 ha) and a maximum and average depth of
4 m and 2 m, respectively. Shrinking of the Beel
due to siltation is its major threat.
21.1.2.3 Flora and Fauna
The Beel has dense AM, as long as the River
Jamuna remains fl ooded during the monsoon
months. Further, the shoreline of the Beel had
dense vegetation which was locally called kash,
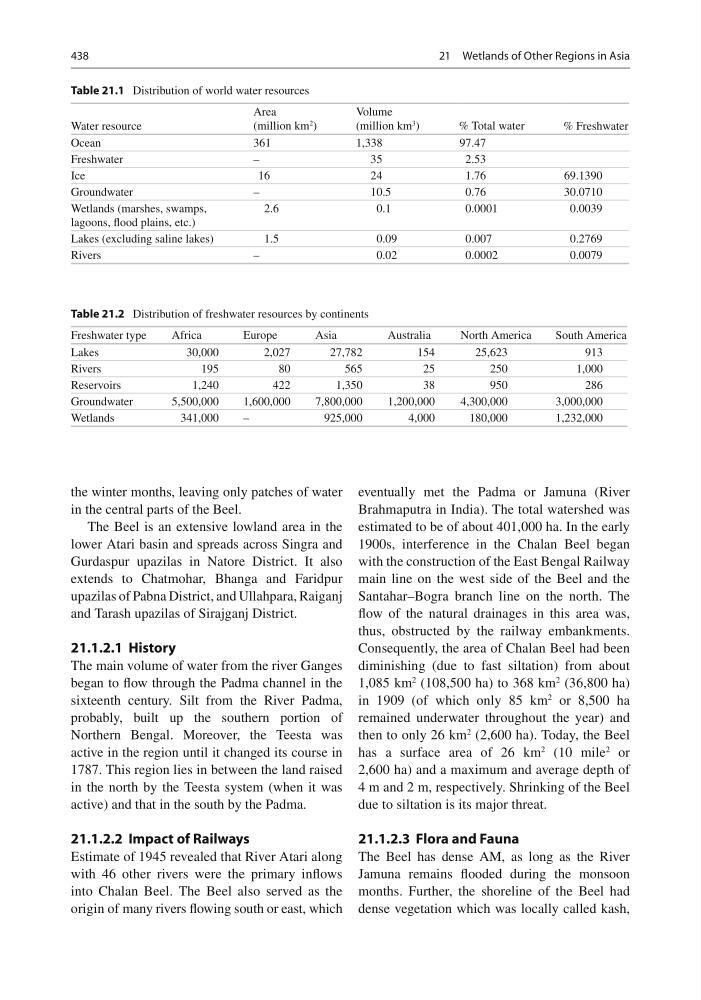
Table 21.1 Distribution of world water resources
Water resource
Area
(million km
2 )
Volume
(million km
3
)
% Total water
% Freshwater
Ocean
361
1,338
97.47
Freshwater
–
35
2.53
Ice
16
24
1.76
69.1390
Groundwater
–
10.5
0.76
30.0710
Wetlands (marshes, swamps,
lagoons, fl ood plains, etc.)
2.6
0.1
0.0001
0.0039
Lakes (excluding saline lakes)
1.5
0.09
0.007
0.2769
Rivers
–
0.02
0.0002
0.0079
Table 21.2 Distribution of freshwater resources by continents
Freshwater type
Africa
Europe
Asia
Australia
North America
South America
Lakes
30,000
2,027
27,782
154
25,623
913
Rivers
195
80
565
25
250
1,000
Reservoirs
1,240
422
1,350
38
950
286
Groundwater
5,500,000
1,600,000
7,800,000
1,200,000
4,300,000
3,000,000
Wetlands
341,000
–
925,000
4,000
180,000
1,232,000
21 Wetlands of Other Regions in Asia
the winter months, leaving only patches of water
in the central parts of the Beel.
The Beel is an extensive lowland area in the
lower Atari basin and spreads across Singra and
Gurdaspur upazilas in Natore District. It also
extends to Chatmohar, Bhanga and Faridpur
upazilas of Pabna District, and Ullahpara, Raiganj
and Tarash upazilas of Sirajganj District.
21.1.2.1 History
The main volume of water from the river Ganges
began to fl ow through the Padma channel in the
sixteenth century. Silt from the River Padma,
probably, built up the southern portion of
Northern Bengal. Moreover, the Teesta was
active in the region until it changed its course in
1787. This region lies in between the land raised
in the north by the Teesta system (when it was
active) and that in the south by the Padma.
21.1.2.2 Impact of Railways
Estimate of 1945 revealed that River Atari along
with 46 other rivers were the primary infl ows
into Chalan Beel. The Beel also served as the
origin of many rivers fl owing south or east, which
eventually met the Padma or Jamuna (River
Brahmaputra in India). The total watershed was
estimated to be of about 401,000 ha. In the early
1900s, interference in the Chalan Beel began
with the construction of the East Bengal Railway
main line on the west side of the Beel and the
Santahar–Bogra branch line on the north. The
fl ow of the natural drainages in this area was,
thus, obstructed by the railway embankments.
Consequently, the area of Chalan Beel had been
diminishing (due to fast siltation) from about
1,085 km
2 (108,500 ha) to 368 km
2 (36,800 ha)
in 1909 (of which only 85 km
2 or 8,500 ha
remained underwater throughout the year) and
then to only 26 km
2 (2,600 ha). Today, the Beel
has a surface area of 26 km
2 (10 mile
2 or
2,600 ha) and a maximum and average depth of
4 m and 2 m, respectively. Shrinking of the Beel
due to siltation is its major threat.
21.1.2.3 Flora and Fauna
The Beel has dense AM, as long as the River
Jamuna remains fl ooded during the monsoon
months. Further, the shoreline of the Beel had
dense vegetation which was locally called kash,
Table 21.1 Distribution of world water resources
Water resource
Area
(million km
2 )
Volume
(million km
3
)
% Total water
% Freshwater
Ocean
361
1,338
97.47
Freshwater
–
35
2.53
Ice
16
24
1.76
69.1390
Groundwater
–
10.5
0.76
30.0710
Wetlands (marshes, swamps,
lagoons, fl ood plains, etc.)
2.6
0.1
0.0001
0.0039
Lakes (excluding saline lakes)
1.5
0.09
0.007
0.2769
Rivers
–
0.02
0.0002
0.0079
Table 21.2 Distribution of freshwater resources by continents
Freshwater type
Africa
Europe
Asia
Australia
North America
South America
Lakes
30,000
2,027
27,782
154
25,623
913
Rivers
195
80
565
25
250
1,000
Reservoirs
1,240
422
1,350
38
950
286
Groundwater
5,500,000
1,600,000
7,800,000
1,200,000
4,300,000
3,000,000
Wetlands
341,000
–
925,000
4,000
180,000
1,232,000
21 Wetlands of Other Regions in Asia