

65
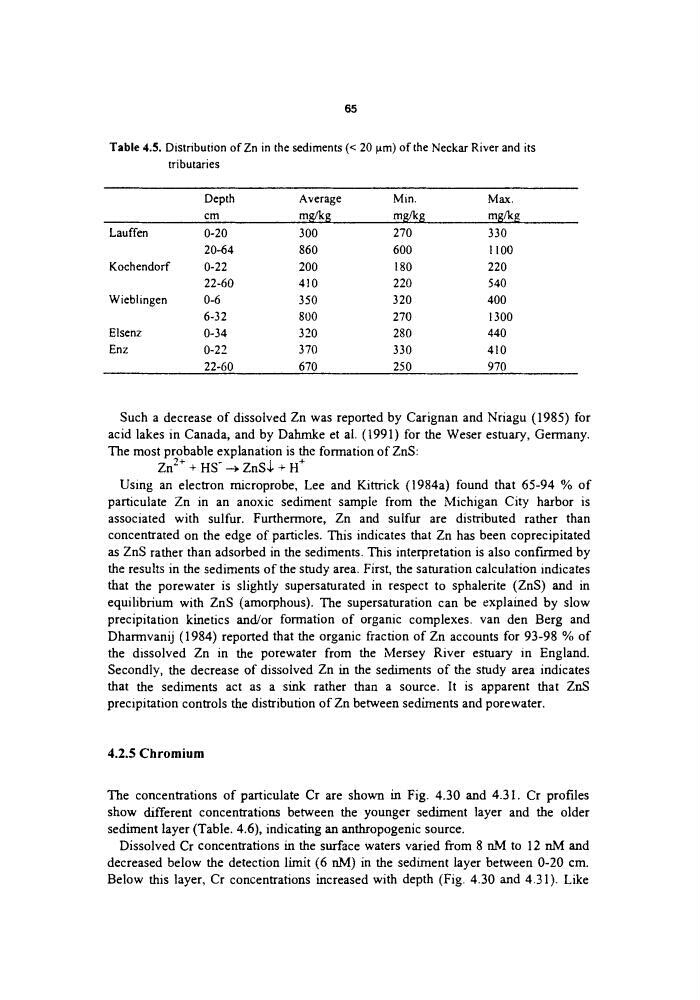
Table 4.5. Distribution of Zn in the sediments (< 20 ~m) of the Neckar River and its
tributaries
Depth
Average
Min.
Max.
cm
m~r/k[[
mg/kg
mg/kg
Lauffen
0-20
300
270
330
20-64
860
600
1 100
Koehendorf
0-22
200
180
220
22-60
410
220
540
Wieblingen
0-6
350
320
400
6-32
800
270
1300
Elsenz
0-34
320
280
440
Enz
0-22
370
330
410
22-60
670
250
970
Such a decrease of dissolved Zn was reported by Carignan and Nriagu (1985) for
acid lakes in Canada, and by Dahmke et al. (1991) for the Weser estuary, Germany.
The most probable explanation is the formation of ZnS:
Zn 2+ + HS- --~ ZnS$ + H §
Using an electron microprobe, Lee and Kittrick (1984a) found that 65-94 % of
particulate Zn in an anoxic sediment sample from the Michigan City harbor is
associated with sulfur. Furthermore, Zn and sulfur are distributed rather than
concentrated on the edge of particles. This indicates that Zn has been coprecipitated
as ZnS rather than adsorbed in the sediments. This interpretation is also confirmed by
the results in the sediments of the study area. First, the saturation calculation indicates
that the porewater is slightly supersaturated in respect to sphalerite (ZnS) and in
equilibrium with ZnS (amorphous). The supersaturation can be explained by slow
precipitation kinetics and/or formation of organic complexes, van den Berg and
Dharmvanij (1984) reported that the organic fraction of Zn accounts for 93-98 % of
the dissolved Zn in the porewater from the Mersey River estuary in England.
Secondly, the decrease of dissolved Zn in the sediments of the study area indicates
that the sediments act as a sink rather than a source. It is apparent that ZnS
precipitation controls the distribution of Zn between sediments and porewater.
4.2.5 Chromium
The concentrations of particulate Cr are shown in Fig. 4.30 and 4.31. Cr profiles
show different concentrations between the younger sediment layer and the older
sediment layer (Table. 4.6), indicating an anthropogenic source.
Dissolved Cr concentrations in the surface waters varied from 8 nM to 12 nM and
decreased below the detection limit (6 nM) in the sediment layer between 0-20 cm.
Below this layer, Cr concentrations increased with depth (Fig. 4.30 and 4.31). Like
Table 4.5. Distribution of Zn in the sediments (< 20 ~m) of the Neckar River and its
tributaries
Depth
Average
Min.
Max.
cm
m~r/k[[
mg/kg
mg/kg
Lauffen
0-20
300
270
330
20-64
860
600
1 100
Koehendorf
0-22
200
180
220
22-60
410
220
540
Wieblingen
0-6
350
320
400
6-32
800
270
1300
Elsenz
0-34
320
280
440
Enz
0-22
370
330
410
22-60
670
250
970
Such a decrease of dissolved Zn was reported by Carignan and Nriagu (1985) for
acid lakes in Canada, and by Dahmke et al. (1991) for the Weser estuary, Germany.
The most probable explanation is the formation of ZnS:
Zn 2+ + HS- --~ ZnS$ + H §
Using an electron microprobe, Lee and Kittrick (1984a) found that 65-94 % of
particulate Zn in an anoxic sediment sample from the Michigan City harbor is
associated with sulfur. Furthermore, Zn and sulfur are distributed rather than
concentrated on the edge of particles. This indicates that Zn has been coprecipitated
as ZnS rather than adsorbed in the sediments. This interpretation is also confirmed by
the results in the sediments of the study area. First, the saturation calculation indicates
that the porewater is slightly supersaturated in respect to sphalerite (ZnS) and in
equilibrium with ZnS (amorphous). The supersaturation can be explained by slow
precipitation kinetics and/or formation of organic complexes, van den Berg and
Dharmvanij (1984) reported that the organic fraction of Zn accounts for 93-98 % of
the dissolved Zn in the porewater from the Mersey River estuary in England.
Secondly, the decrease of dissolved Zn in the sediments of the study area indicates
that the sediments act as a sink rather than a source. It is apparent that ZnS
precipitation controls the distribution of Zn between sediments and porewater.
4.2.5 Chromium
The concentrations of particulate Cr are shown in Fig. 4.30 and 4.31. Cr profiles
show different concentrations between the younger sediment layer and the older
sediment layer (Table. 4.6), indicating an anthropogenic source.
Dissolved Cr concentrations in the surface waters varied from 8 nM to 12 nM and
decreased below the detection limit (6 nM) in the sediment layer between 0-20 cm.
Below this layer, Cr concentrations increased with depth (Fig. 4.30 and 4.31). Like