

Spatial Modeling of Nitrogen Leaching
43
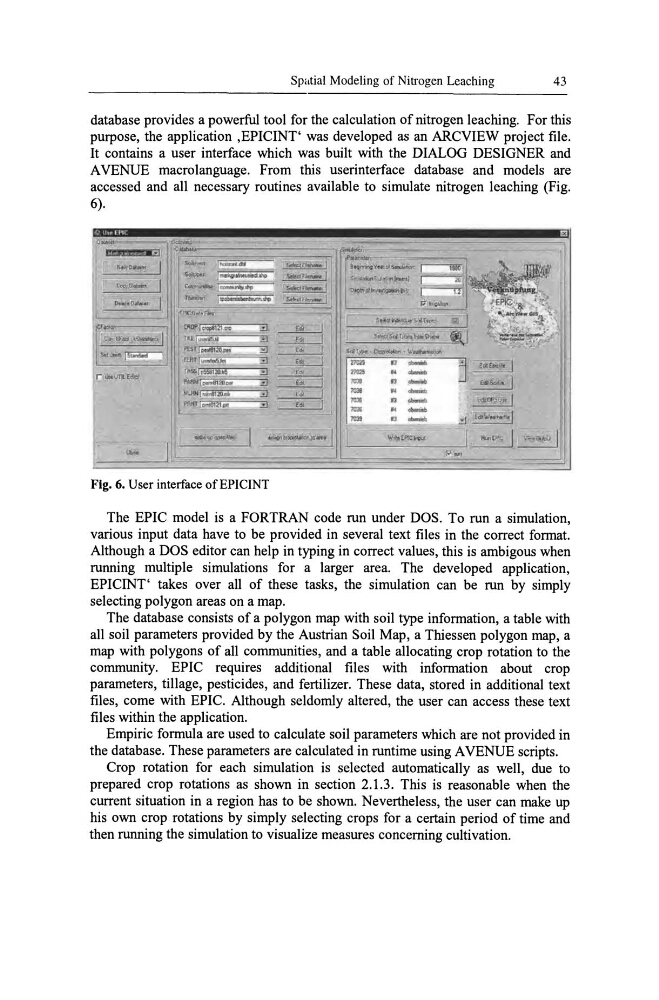
database provides a powerful tool for the calculation of nitrogen leaching. For this
purpose, the application ,EPICINT' was developed as an ARCVIEW project file.
lt contains a user interface which was built with the DIALOG DESIGNER and
A VENUE macro language. From this userinterface database and models are
accessed and all necessary routines available to simulate nitrogen leaching (Fig.
6).
IiclIT~~."'~
211125
II
-
'&;
!dl.Eplcrn-1
21IIl5
.. -
"'"
II
-
: Edl!¥lf_1
"'"
. . -
"'"
II
-
~0P1fI" I
,.,.
. . - ~ ' ............. 1
"'" " -
Fig. 6. User interface of EPICINT
The EPIC model is a FORTRAN code run under DOS. To run a simulation,
various input data have to be provided in several text files in the correct fonnat.
Although a DOS editor can help in typing in correct values, this is ambigous when
running multiple simulations for a larger area. The developed application,
EPICINT' takes over all of these tasks, the simulation can be run by simply
selecting polygon areas on a map.
The database consists of a polygon map with soil type infonnation, a table with
all soil parameters provided by the Austrian Soil Map, a Thiessen polygon map, a
map with polygons of all communities, and a table allocating crop rotation to the
community. EPIC requires additional files with infonnation about crop
parameters, tillage, pesticides, and fertilizer. These data, stored in additional text
files, come with EPIC. Although seldomly altered, the user can access these text
files within the application.
Empiric fonnula are used to calculate soil parameters which are not provided in
the database. These parameters are calculated in runtime using A VENUE scripts.
Crop rotation for each simulation is selected automatically as well, due to
prepared crop rotations as shown in section 2.1.3. This is reasonable when the
current situation in a region has to be shown. Nevertheless, the user can make up
his own crop rotations by simply selecting crops for a certain period of time and
then running the simulation to visualize measures concerning cultivation.
43
database provides a powerful tool for the calculation of nitrogen leaching. For this
purpose, the application ,EPICINT' was developed as an ARCVIEW project file.
lt contains a user interface which was built with the DIALOG DESIGNER and
A VENUE macro language. From this userinterface database and models are
accessed and all necessary routines available to simulate nitrogen leaching (Fig.
6).
IiclIT~~."'~
211125
II
-
'&;
!dl.Eplcrn-1
21IIl5
.. -
"'"
II
-
: Edl!¥lf_1
"'"
. . -
"'"
II
-
~0P1fI" I
,.,.
. . - ~ ' ............. 1
"'" " -
Fig. 6. User interface of EPICINT
The EPIC model is a FORTRAN code run under DOS. To run a simulation,
various input data have to be provided in several text files in the correct fonnat.
Although a DOS editor can help in typing in correct values, this is ambigous when
running multiple simulations for a larger area. The developed application,
EPICINT' takes over all of these tasks, the simulation can be run by simply
selecting polygon areas on a map.
The database consists of a polygon map with soil type infonnation, a table with
all soil parameters provided by the Austrian Soil Map, a Thiessen polygon map, a
map with polygons of all communities, and a table allocating crop rotation to the
community. EPIC requires additional files with infonnation about crop
parameters, tillage, pesticides, and fertilizer. These data, stored in additional text
files, come with EPIC. Although seldomly altered, the user can access these text
files within the application.
Empiric fonnula are used to calculate soil parameters which are not provided in
the database. These parameters are calculated in runtime using A VENUE scripts.
Crop rotation for each simulation is selected automatically as well, due to
prepared crop rotations as shown in section 2.1.3. This is reasonable when the
current situation in a region has to be shown. Nevertheless, the user can make up
his own crop rotations by simply selecting crops for a certain period of time and
then running the simulation to visualize measures concerning cultivation.