

Water Sources and Quality Along the Lower Jordan River
147
1400
. , Eastern inflows
1200
I
,
Northern saline groundwater
I
1000
,
•
,,-......
I
-- --I
00
•
S
I
Calculated
"-"
800
I
unknown
Q)
I
/ .
......
~
600
I
-I
;:j
VJ.
"
"
I
m" ... "
400
T
~
,,".
I
"
•
. , , "
A
I
,,""A ... ~
200
I
sewage effluents
... ~ "
"
Western inflows
0
500
1000
1500
2000
2500
Chloride (mg/I)
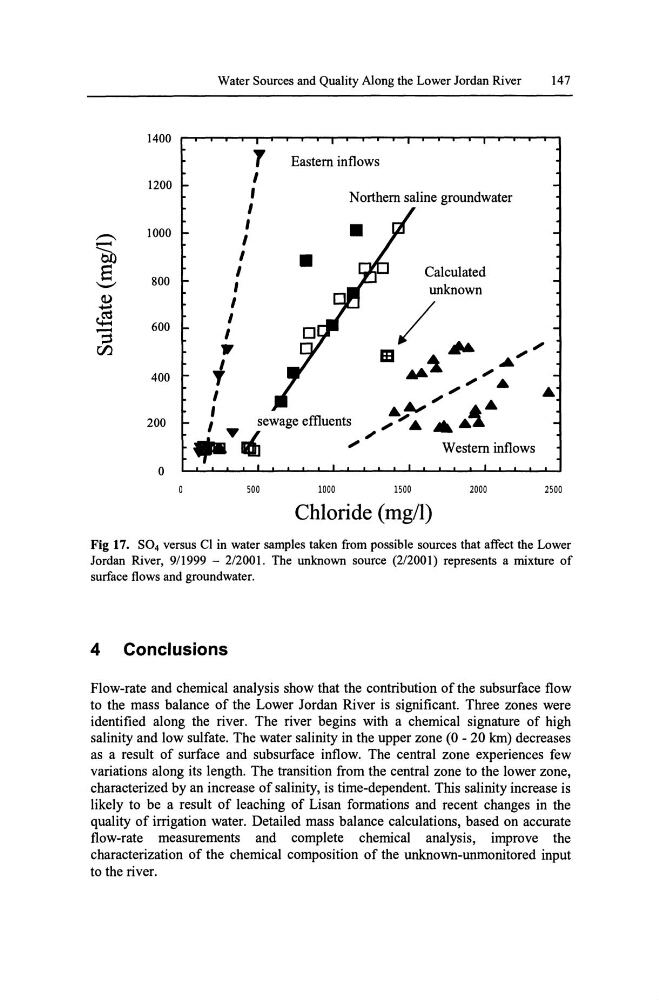
Fig 17. S04 versus Cl in water samples taken from possible sources that affect the Lower
Jordan River, 9/1999 - 2/2001. The unknown source (2/2001) represents a mixture of
surface flows and groundwater.
4 Conclusions
Flow-rate and chemical analysis show that the contribution of the subsurface flow
to the mass balance of the Lower Jordan River is significant. Three zones were
identified along the river. The river begins with a chemical signature of high
salinity and low sulfate. The water salinity in the upper zone (0 - 20 km) decreases
as a result of surface and subsurface inflow. The central zone experiences few
variations along its length. The transition from the central zone to the lower zone,
characterized by an increase of salinity, is time-dependent. This salinity increase is
likely to be a result of leaching of Lisan formations and recent changes in the
quality of irrigation water. Detailed mass balance calculations, based on accurate
flow-rate measurements and complete chemical analysis, improve the
characterization of the chemical composition of the unknown-unmonitored input
to the river.
147
1400
. , Eastern inflows
1200
I
,
Northern saline groundwater
I
1000
,
•
,,-......
I
-- --I
00
•
S
I
Calculated
"-"
800
I
unknown
Q)
I
/ .
......
~
600
I
-I
;:j
VJ.
"
"
I
m" ... "
400
T
~
,,".
I
"
•
. , , "
A
I
,,""A ... ~
200
I
sewage effluents
... ~ "
"
Western inflows
0
500
1000
1500
2000
2500
Chloride (mg/I)
Fig 17. S04 versus Cl in water samples taken from possible sources that affect the Lower
Jordan River, 9/1999 - 2/2001. The unknown source (2/2001) represents a mixture of
surface flows and groundwater.
4 Conclusions
Flow-rate and chemical analysis show that the contribution of the subsurface flow
to the mass balance of the Lower Jordan River is significant. Three zones were
identified along the river. The river begins with a chemical signature of high
salinity and low sulfate. The water salinity in the upper zone (0 - 20 km) decreases
as a result of surface and subsurface inflow. The central zone experiences few
variations along its length. The transition from the central zone to the lower zone,
characterized by an increase of salinity, is time-dependent. This salinity increase is
likely to be a result of leaching of Lisan formations and recent changes in the
quality of irrigation water. Detailed mass balance calculations, based on accurate
flow-rate measurements and complete chemical analysis, improve the
characterization of the chemical composition of the unknown-unmonitored input
to the river.