

Metals
215
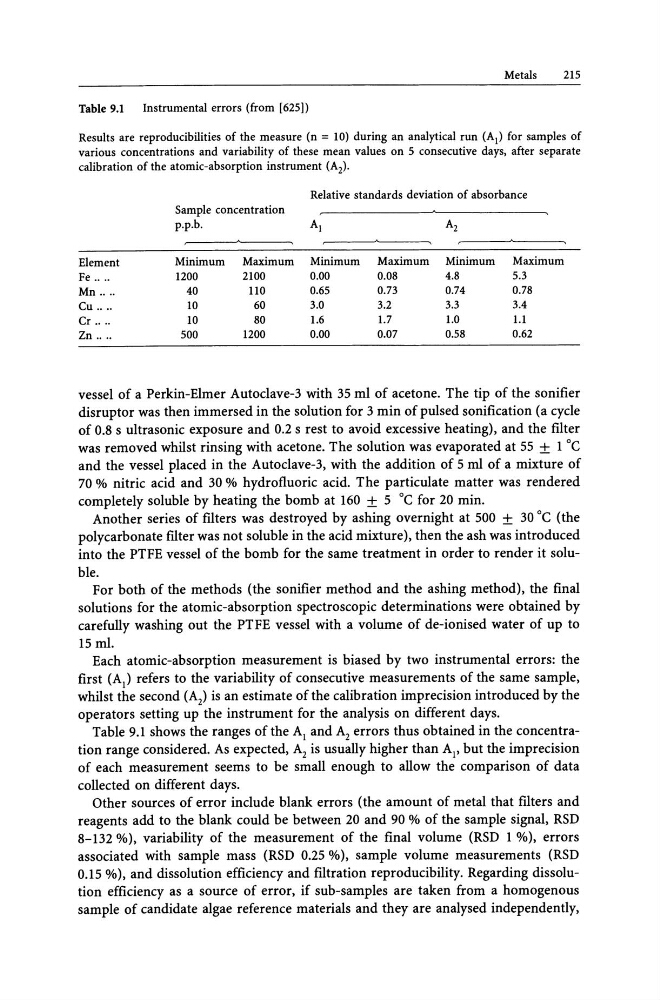
Table 9.1
Instrumental errors (from [625])
Results are reproducibilities of the measure (n = 10) during an analytical run (AI) for samples of
various concentrations and variability of these mean values on 5 consecutive days, after separate
calibration of the atomic-absorption instrument (A z ).
Relative standards deviation of absorbance
Sample concentration
p.p.b.
Al
A z
Element
Minimum
Maximum Minimum
Maximum Minimum Maximum
Fe ....
1200
2100
0.00
0.08
4.8
5.3
Mn ....
40
110
0.65
0.73
0.74
0.78
Cu ....
10
60
3.0
3.2
3.3
3.4
Cr ....
10
80
1.6
1.7
1.0
1.1
Zn ....
500
1200
0.00
0.07
0.58
0.62
vessel of a Perkin-Elmer Autoclave-3 with 35 ml of acetone. The tip of the sonifier
disruptor was then immersed in the solution for 3 min of pulsed sonification (a cycle
of 0.8 s ultrasonic exposure and 0.2 s rest to avoid excessive heating), and the filter
was removed whilst rinsing with acetone. The solution was evaporated at 55 ± 1 °c
and the vessel placed in the Autoclave-3, with the addition of 5 ml of a mixture of
70 % nitric acid and 30 % hydrofluoric acid. The particulate matter was rendered
completely soluble by heating the bomb at 160 ± 5 °c for 20 min.
Another series of filters was destroyed by ashing overnight at 500 ± 30°C (the
polycarbonate filter was not soluble in the acid mixture), then the ash was introduced
into the PTFE vessel of the bomb for the same treatment in order to render it soluble.
For both of the methods (the sonifier method and the ashing method), the final
solutions for the atomic-absorption spectroscopic determinations were obtained by
carefully washing out the PTFE vessel with a volume of de-ionised water of up to
15 ml.
Each atomic-absorption measurement is biased by two instrumental errors: the
first (A) refers to the variability of consecutive measurements of the same sample,
whilst the second (A z ) is an estimate of the calibration imprecision introduced by the
operators setting up the instrument for the analysis on different days.
Table 9.1 shows the ranges of the Al and A z errors thus obtained in the concentration range considered. As expected, A z is usually higher than AI' but the imprecision
of each measurement seems to be small enough to allow the comparison of data
collected on different days.
Other sources of error include blank errors (the amount of metal that filters and
reagents add to the blank could be between 20 and 90 % of the sample signal, RSD
8-132 %), variability of the measurement of the final volume (RSD 1 %), errors
associated with sample mass (RSD 0.25 %), sample volume measurements (RSD
0.15 %), and dissolution efficiency and filtration reproducibility. Regarding dissolution efficiency as a source of error, if sub-samples are taken from a homogenous
sample of candidate algae reference materials and they are analysed independently,
215
Table 9.1
Instrumental errors (from [625])
Results are reproducibilities of the measure (n = 10) during an analytical run (AI) for samples of
various concentrations and variability of these mean values on 5 consecutive days, after separate
calibration of the atomic-absorption instrument (A z ).
Relative standards deviation of absorbance
Sample concentration
p.p.b.
Al
A z
Element
Minimum
Maximum Minimum
Maximum Minimum Maximum
Fe ....
1200
2100
0.00
0.08
4.8
5.3
Mn ....
40
110
0.65
0.73
0.74
0.78
Cu ....
10
60
3.0
3.2
3.3
3.4
Cr ....
10
80
1.6
1.7
1.0
1.1
Zn ....
500
1200
0.00
0.07
0.58
0.62
vessel of a Perkin-Elmer Autoclave-3 with 35 ml of acetone. The tip of the sonifier
disruptor was then immersed in the solution for 3 min of pulsed sonification (a cycle
of 0.8 s ultrasonic exposure and 0.2 s rest to avoid excessive heating), and the filter
was removed whilst rinsing with acetone. The solution was evaporated at 55 ± 1 °c
and the vessel placed in the Autoclave-3, with the addition of 5 ml of a mixture of
70 % nitric acid and 30 % hydrofluoric acid. The particulate matter was rendered
completely soluble by heating the bomb at 160 ± 5 °c for 20 min.
Another series of filters was destroyed by ashing overnight at 500 ± 30°C (the
polycarbonate filter was not soluble in the acid mixture), then the ash was introduced
into the PTFE vessel of the bomb for the same treatment in order to render it soluble.
For both of the methods (the sonifier method and the ashing method), the final
solutions for the atomic-absorption spectroscopic determinations were obtained by
carefully washing out the PTFE vessel with a volume of de-ionised water of up to
15 ml.
Each atomic-absorption measurement is biased by two instrumental errors: the
first (A) refers to the variability of consecutive measurements of the same sample,
whilst the second (A z ) is an estimate of the calibration imprecision introduced by the
operators setting up the instrument for the analysis on different days.
Table 9.1 shows the ranges of the Al and A z errors thus obtained in the concentration range considered. As expected, A z is usually higher than AI' but the imprecision
of each measurement seems to be small enough to allow the comparison of data
collected on different days.
Other sources of error include blank errors (the amount of metal that filters and
reagents add to the blank could be between 20 and 90 % of the sample signal, RSD
8-132 %), variability of the measurement of the final volume (RSD 1 %), errors
associated with sample mass (RSD 0.25 %), sample volume measurements (RSD
0.15 %), and dissolution efficiency and filtration reproducibility. Regarding dissolution efficiency as a source of error, if sub-samples are taken from a homogenous
sample of candidate algae reference materials and they are analysed independently,