

200
Crustacea and Molluscs
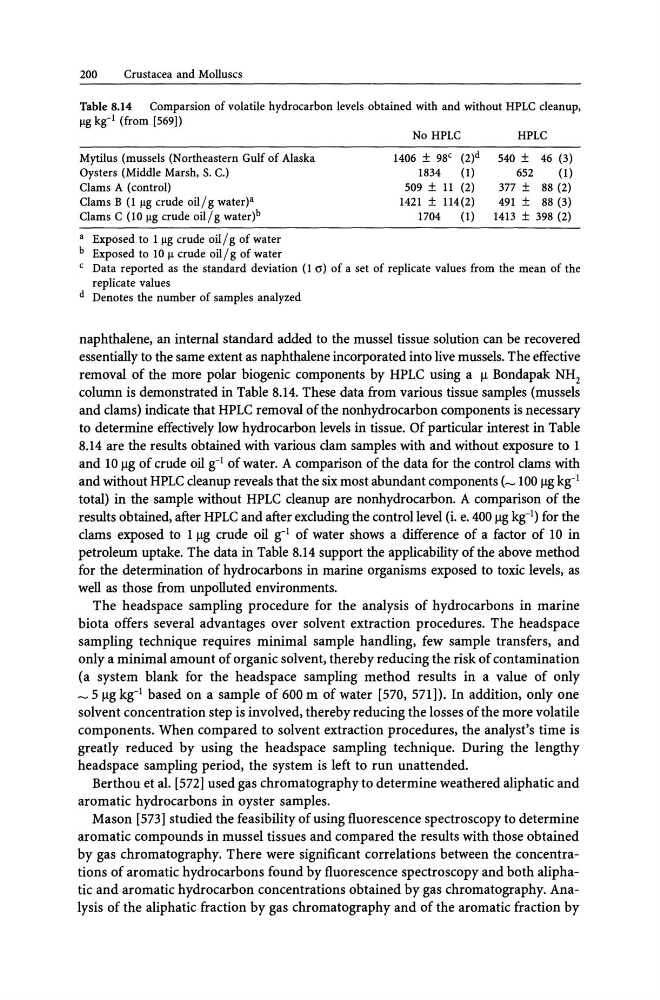
Table 8.14 Comparsion of volatile hydrocarbon levels obtained with and without HPLC cleanup,
I1g kg- I (from [569))
Mytilus (mussels (Northeastern Gulf of Alaska
Oysters (Middle Marsh, S. C.)
Clams A (control)
Clams B (1 I1S crude oil I g water)"
Clams C (10 I1S crude oil I g water)b
" Exposed to 1 I1S crude oil I g of water
b Exposed to 10 11 crude oil I g of water
No HPLC
HPLC
1406 ± 98 c (2)d
1834
(1)
509 ± 11 (2)
1421 ± 114(2)
1704
(1)
540 ± 46 (3)
652
(1)
377 ± 88 (2)
491 ± 88 (3)
1413 ± 398 (2)
c Data reported as the standard deviation (1 (1) of a set of replicate values from the mean of the
replicate values
d Denotes the number of samples analyzed
naphthalene, an internal standard added to the mussel tissue solution can be recovered
essentially to the same extent as naphthalene incorporated into live mussels. The effective
removal of the more polar biogenic components by HPLC using a ~ Bondapak NH2
column is demonstrated in Table 8.14. These data from various tissue samples (mussels
and clams) indicate that HPLC removal of the nonhydrocarbon components is necessary
to determine effectively low hydrocarbon levels in tissue. Of particular interest in Table
8.14 are the results obtained with various clam samples with and without exposure to 1
and 10 ~ of crude oil g-I of water. A comparison of the data for the control clams with
and without HPLC cleanup reveals that the six most abundant components (~ 100 ~ kg-I
total) in the sample without HPLC cleanup are nonhydrocarbon. A comparison of the
results obtained, after HPLC and after excluding the control level (i. e. 400 ~ kg-I) for the
clams exposed to 1 ~ crude oil g-I of water shows a difference of a factor of 10 in
petroleum uptake. The data in Table 8.14 support the applicability of the above method
for the determination of hydrocarbons in marine organisms exposed to toxic levels, as
well as those from unpolluted environments.
The headspace sampling procedure for the analysis of hydrocarbons in marine
biota offers several advantages over solvent extraction procedures. The headspace
sampling technique requires minimal sample handling, few sample transfers, and
only a minimal amount of organic solvent, thereby reducing the risk of contamination
(a system blank for the headspace sampling method results in a value of only
_ 5 ~ kg- I based on a sample of 600 m of water [570, 571]). In addition, only one
solvent concentration step is involved, thereby reducing the losses of the more volatile
components. When compared to solvent extraction procedures, the analyst's time is
greatly reduced by using the headspace sampling technique. During the lengthy
headspace sampling period, the system is left to run unattended.
Berthou et al. [572] used gas chromatography to determine weathered aliphatic and
aromatic hydrocarbons in oyster samples.
Mason [573] studied the feasibility of using fluorescence spectroscopy to determine
aromatic compounds in mussel tissues and compared the results with those obtained
by gas chromatography. There were significant correlations between the concentrations of aromatic hydrocarbons found by fluorescence spectroscopy and both aliphatic and aromatic hydrocarbon concentrations obtained by gas chromatography. Analysis of the aliphatic fraction by gas chromatography and of the aromatic fraction by
Crustacea and Molluscs
Table 8.14 Comparsion of volatile hydrocarbon levels obtained with and without HPLC cleanup,
I1g kg- I (from [569))
Mytilus (mussels (Northeastern Gulf of Alaska
Oysters (Middle Marsh, S. C.)
Clams A (control)
Clams B (1 I1S crude oil I g water)"
Clams C (10 I1S crude oil I g water)b
" Exposed to 1 I1S crude oil I g of water
b Exposed to 10 11 crude oil I g of water
No HPLC
HPLC
1406 ± 98 c (2)d
1834
(1)
509 ± 11 (2)
1421 ± 114(2)
1704
(1)
540 ± 46 (3)
652
(1)
377 ± 88 (2)
491 ± 88 (3)
1413 ± 398 (2)
c Data reported as the standard deviation (1 (1) of a set of replicate values from the mean of the
replicate values
d Denotes the number of samples analyzed
naphthalene, an internal standard added to the mussel tissue solution can be recovered
essentially to the same extent as naphthalene incorporated into live mussels. The effective
removal of the more polar biogenic components by HPLC using a ~ Bondapak NH2
column is demonstrated in Table 8.14. These data from various tissue samples (mussels
and clams) indicate that HPLC removal of the nonhydrocarbon components is necessary
to determine effectively low hydrocarbon levels in tissue. Of particular interest in Table
8.14 are the results obtained with various clam samples with and without exposure to 1
and 10 ~ of crude oil g-I of water. A comparison of the data for the control clams with
and without HPLC cleanup reveals that the six most abundant components (~ 100 ~ kg-I
total) in the sample without HPLC cleanup are nonhydrocarbon. A comparison of the
results obtained, after HPLC and after excluding the control level (i. e. 400 ~ kg-I) for the
clams exposed to 1 ~ crude oil g-I of water shows a difference of a factor of 10 in
petroleum uptake. The data in Table 8.14 support the applicability of the above method
for the determination of hydrocarbons in marine organisms exposed to toxic levels, as
well as those from unpolluted environments.
The headspace sampling procedure for the analysis of hydrocarbons in marine
biota offers several advantages over solvent extraction procedures. The headspace
sampling technique requires minimal sample handling, few sample transfers, and
only a minimal amount of organic solvent, thereby reducing the risk of contamination
(a system blank for the headspace sampling method results in a value of only
_ 5 ~ kg- I based on a sample of 600 m of water [570, 571]). In addition, only one
solvent concentration step is involved, thereby reducing the losses of the more volatile
components. When compared to solvent extraction procedures, the analyst's time is
greatly reduced by using the headspace sampling technique. During the lengthy
headspace sampling period, the system is left to run unattended.
Berthou et al. [572] used gas chromatography to determine weathered aliphatic and
aromatic hydrocarbons in oyster samples.
Mason [573] studied the feasibility of using fluorescence spectroscopy to determine
aromatic compounds in mussel tissues and compared the results with those obtained
by gas chromatography. There were significant correlations between the concentrations of aromatic hydrocarbons found by fluorescence spectroscopy and both aliphatic and aromatic hydrocarbon concentrations obtained by gas chromatography. Analysis of the aliphatic fraction by gas chromatography and of the aromatic fraction by