

Organics
197
Table 8.12
Hydrocarbon content of shrimps (from [568))
Saturated Hydrocarbons
Unsaturated Hydrocarbons
Nonpolar Column Polar
Column NonpolarColumn Polar
Column
Organism
K.I."
Wt %
K.I.a
Wt %
K.I."
Wt %
K.I.a
wt %
Penaeus setiferus
2248
15
2271
15
2508
23
Penaeus duoraroum 2506
34
2894
8
Trachypenaeus similis 2506
31
Squilla empusa
Squilla chydea
2894
7
2244
11
2249
11
2507
16
1703
1803
1977
2510
15
8
10
16
a Peaks labelled by Kovats Index
2967
3013
3140
2343
3145
2495
2798
3144
2043
2253
1699
1800
19
13
19
29
26
7
8
26
35
27
8
5
2202
11
3144
11
1935
14
2237
16
2114
20
2453
14
2143
11
2475
16
2274
18
2843
14
1950
19
2224
11
2133
15
2244
11
2300
18
2461
27
2477
11
2810
16
1921
14
2222
16
2099
20
2430
11
2125
10
2455
18
2256
18
2826
13
1933
20
2234
23
2103
13
2438
12
2133
11
2463
11
2263
13
2833
10
2445
10
1911
10
2219
14
2005
8
2352
11
2087
13
2449
11
2237
8
2824
8
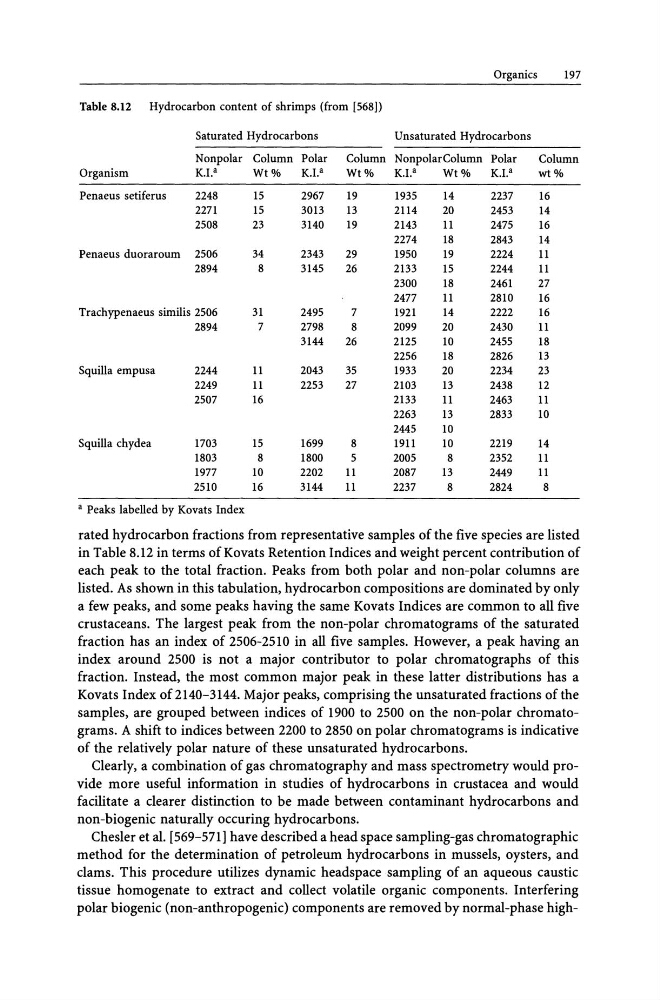
rated hydrocarbon fractions from representative samples of the five species are listed
in Table 8.12 in terms of Kovats Retention Indices and weight percent contribution of
each peak to the total fraction. Peaks from both polar and non-polar columns are
listed. As shown in this tabulation, hydrocarbon compositions are dominated by only
a few peaks, and some peaks having the same Kovats Indices are common to all five
crustaceans. The largest peak from the non-polar chromatograms of the saturated
fraction has an index of 2506-2510 in all five samples. However, a peak having an
index around 2500 is not a major contributor to polar chromatographs of this
fraction. Instead, the most common major peak in these latter distributions has a
Kovats Index of 2140-3144. Major peaks, comprising the unsaturated fractions of the
samples, are grouped between indices of 1900 to 2500 on the non-polar chromatograms. A shift to indices between 2200 to 2850 on polar chromatograms is indicative
of the relatively polar nature of these unsaturated hydrocarbons.
Clearly, a combination of gas chromatography and mass spectrometry would provide more useful information in studies of hydrocarbons in crustacea and would
facilitate a clearer distinction to be made between contaminant hydrocarbons and
non-biogenic naturally occuring hydrocarbons.
Chesler et al. [569-571] have described a head space sampling-gas chromatographic
method for the determination of petroleum hydrocarbons in mussels, oysters, and
clams. This procedure utilizes dynamic headspacesampling of an aqueous caustic
tissue homogenate to extract and collect volatile organic components. Interfering
polar biogenic (non-anthropogenic) components are removed by normal-phase high-
197
Table 8.12
Hydrocarbon content of shrimps (from [568))
Saturated Hydrocarbons
Unsaturated Hydrocarbons
Nonpolar Column Polar
Column NonpolarColumn Polar
Column
Organism
K.I."
Wt %
K.I.a
Wt %
K.I."
Wt %
K.I.a
wt %
Penaeus setiferus
2248
15
2271
15
2508
23
Penaeus duoraroum 2506
34
2894
8
Trachypenaeus similis 2506
31
Squilla empusa
Squilla chydea
2894
7
2244
11
2249
11
2507
16
1703
1803
1977
2510
15
8
10
16
a Peaks labelled by Kovats Index
2967
3013
3140
2343
3145
2495
2798
3144
2043
2253
1699
1800
19
13
19
29
26
7
8
26
35
27
8
5
2202
11
3144
11
1935
14
2237
16
2114
20
2453
14
2143
11
2475
16
2274
18
2843
14
1950
19
2224
11
2133
15
2244
11
2300
18
2461
27
2477
11
2810
16
1921
14
2222
16
2099
20
2430
11
2125
10
2455
18
2256
18
2826
13
1933
20
2234
23
2103
13
2438
12
2133
11
2463
11
2263
13
2833
10
2445
10
1911
10
2219
14
2005
8
2352
11
2087
13
2449
11
2237
8
2824
8
rated hydrocarbon fractions from representative samples of the five species are listed
in Table 8.12 in terms of Kovats Retention Indices and weight percent contribution of
each peak to the total fraction. Peaks from both polar and non-polar columns are
listed. As shown in this tabulation, hydrocarbon compositions are dominated by only
a few peaks, and some peaks having the same Kovats Indices are common to all five
crustaceans. The largest peak from the non-polar chromatograms of the saturated
fraction has an index of 2506-2510 in all five samples. However, a peak having an
index around 2500 is not a major contributor to polar chromatographs of this
fraction. Instead, the most common major peak in these latter distributions has a
Kovats Index of 2140-3144. Major peaks, comprising the unsaturated fractions of the
samples, are grouped between indices of 1900 to 2500 on the non-polar chromatograms. A shift to indices between 2200 to 2850 on polar chromatograms is indicative
of the relatively polar nature of these unsaturated hydrocarbons.
Clearly, a combination of gas chromatography and mass spectrometry would provide more useful information in studies of hydrocarbons in crustacea and would
facilitate a clearer distinction to be made between contaminant hydrocarbons and
non-biogenic naturally occuring hydrocarbons.
Chesler et al. [569-571] have described a head space sampling-gas chromatographic
method for the determination of petroleum hydrocarbons in mussels, oysters, and
clams. This procedure utilizes dynamic headspacesampling of an aqueous caustic
tissue homogenate to extract and collect volatile organic components. Interfering
polar biogenic (non-anthropogenic) components are removed by normal-phase high-