

Metals
123
91-107 %. Down to 0.2 pg cadmium in the injected portion of sample could be
determined. Cadmium contents determined by this technique were in good agreement with those obtained by anodic scanning voItammetry.
7.1.3
Cobalt
Kuriyama and Kuroda [361] applied their combined ion-exchange spectrophotometric procedure to the simultaneous determination of cobalt and vanadium in
cutlass fish. In this procedure, the sample is dry ashed at 420°C, the ash (ca. 0.5 g) is
decomposed with a mixture of perchloric, nitric, and hydrofluoric acids, and is finally
taken up in hydrochloric acid. The metals are adsorbed by anion exchange on an
Amberlite CG 400 (SCN-) column from a dilute ammonium thiocyanate-hydrochloric
acid solution. The adsorbed vanadium and cobalt are separated chromatographically
by elution with 12 mol I-I hydrochloric acid and 2 mol I-I perchloric acid, respectively.
Both fractions of vanadium and cobalt are subsequently purified by anion exchange
from 0.1 mol I-I hydrochloric acid - 3 vol. % hydrogen peroxide for vanadium and
6 mol I-I hydrochloric acid for cobalt. Vanadium and cobalt in the effluents are
determined spectrophotometrically with 4-(2-pyrid-ylazo) resorcinol. A 98.2 % recovery of cobalt was obtained by this procedure in the presence of appreciable excesses
of elements also likely to occur in the sample, namely magnesium, calcium, aluminium, iron, copper, nickel, and zinc.
7.7.4
Copper
Spark source mass spectrometry, employing copper 65 and copper 63 stable isotopes,
has been used to study the uptake of copper by Harvey [362]. An attractive feature of
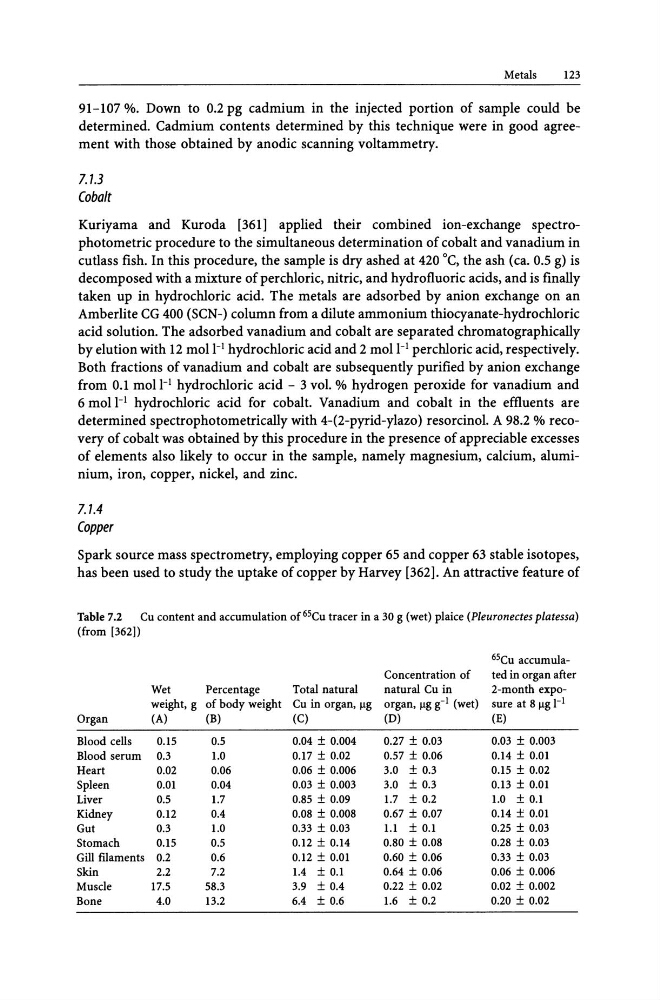
Table 7.2
Cu content and accumulation of 65Cu tracer in a 30 g (wet) plaice (PleuTonectes platessa)
(from [362])
65Cu accumulaConcentration of
ted in organ after
Wet
Percentage
Total natural
natural Cu in
2-month expoweight, g of body weight Cu in organ, I1S organ, Ilg g-I (wet) sure at 8 I1S I-I
Organ
(A)
(B)
(C)
(D)
(E)
Blood cells
0.15
0.5
0.04 ± 0.004
0.27 ± 0.03
0.03 ± 0.003
Blood serum 0.3
1.0
0.17 ± 0.02
0.57 ± 0.06
0.14 ± 0.01
Heart
0.02
0.06
0.06 ± 0.006
3.0 ± 0.3
0.15 ± 0.02
Spleen
0.01
0.04
0.03 ± 0.003
3.0 ± 0.3
0.13 ± O.oI
Liver
0.5
1.7
0.85 ± 0.09
1.7 ± 0.2
1.0 ± 0.1
Kidney
0.12
0.4
0.08 ± 0.008
0.67 ± 0.07
0.14 ± 0.01
Gut
0.3
1.0
0.33 ± 0.03
1.1 ± 0.1
0.25 ± 0.03
Stomach
0.15
0.5
0.12 ± 0.14
0.80 ± 0.08
0.28 ± 0.03
Gill filaments 0.2
0.6
0.12 ± 0.01
0.60 ± 0.06
0.33 ± 0.03
Skin
2.2
7.2
1.4 ± 0.1
0.64 ± 0.06
0.06 ± 0.006
Muscle
17.5
58.3
3.9 ±0.4
0.22 ± 0.02
0.02 ± 0.002
Bone
4.0
13.2
6.4 ± 0.6
1.6 ± 0.2
0.20 ± 0.02
123
91-107 %. Down to 0.2 pg cadmium in the injected portion of sample could be
determined. Cadmium contents determined by this technique were in good agreement with those obtained by anodic scanning voItammetry.
7.1.3
Cobalt
Kuriyama and Kuroda [361] applied their combined ion-exchange spectrophotometric procedure to the simultaneous determination of cobalt and vanadium in
cutlass fish. In this procedure, the sample is dry ashed at 420°C, the ash (ca. 0.5 g) is
decomposed with a mixture of perchloric, nitric, and hydrofluoric acids, and is finally
taken up in hydrochloric acid. The metals are adsorbed by anion exchange on an
Amberlite CG 400 (SCN-) column from a dilute ammonium thiocyanate-hydrochloric
acid solution. The adsorbed vanadium and cobalt are separated chromatographically
by elution with 12 mol I-I hydrochloric acid and 2 mol I-I perchloric acid, respectively.
Both fractions of vanadium and cobalt are subsequently purified by anion exchange
from 0.1 mol I-I hydrochloric acid - 3 vol. % hydrogen peroxide for vanadium and
6 mol I-I hydrochloric acid for cobalt. Vanadium and cobalt in the effluents are
determined spectrophotometrically with 4-(2-pyrid-ylazo) resorcinol. A 98.2 % recovery of cobalt was obtained by this procedure in the presence of appreciable excesses
of elements also likely to occur in the sample, namely magnesium, calcium, aluminium, iron, copper, nickel, and zinc.
7.7.4
Copper
Spark source mass spectrometry, employing copper 65 and copper 63 stable isotopes,
has been used to study the uptake of copper by Harvey [362]. An attractive feature of
Table 7.2
Cu content and accumulation of 65Cu tracer in a 30 g (wet) plaice (PleuTonectes platessa)
(from [362])
65Cu accumulaConcentration of
ted in organ after
Wet
Percentage
Total natural
natural Cu in
2-month expoweight, g of body weight Cu in organ, I1S organ, Ilg g-I (wet) sure at 8 I1S I-I
Organ
(A)
(B)
(C)
(D)
(E)
Blood cells
0.15
0.5
0.04 ± 0.004
0.27 ± 0.03
0.03 ± 0.003
Blood serum 0.3
1.0
0.17 ± 0.02
0.57 ± 0.06
0.14 ± 0.01
Heart
0.02
0.06
0.06 ± 0.006
3.0 ± 0.3
0.15 ± 0.02
Spleen
0.01
0.04
0.03 ± 0.003
3.0 ± 0.3
0.13 ± O.oI
Liver
0.5
1.7
0.85 ± 0.09
1.7 ± 0.2
1.0 ± 0.1
Kidney
0.12
0.4
0.08 ± 0.008
0.67 ± 0.07
0.14 ± 0.01
Gut
0.3
1.0
0.33 ± 0.03
1.1 ± 0.1
0.25 ± 0.03
Stomach
0.15
0.5
0.12 ± 0.14
0.80 ± 0.08
0.28 ± 0.03
Gill filaments 0.2
0.6
0.12 ± 0.01
0.60 ± 0.06
0.33 ± 0.03
Skin
2.2
7.2
1.4 ± 0.1
0.64 ± 0.06
0.06 ± 0.006
Muscle
17.5
58.3
3.9 ±0.4
0.22 ± 0.02
0.02 ± 0.002
Bone
4.0
13.2
6.4 ± 0.6
1.6 ± 0.2
0.20 ± 0.02