

114
Estuarine Sediments
Inductively Coupled Plasma Atomic Emission Spectrometry. The application of this
technique to estuarine sediment analysis has been invesitagated by several workers
[332, 335-337].
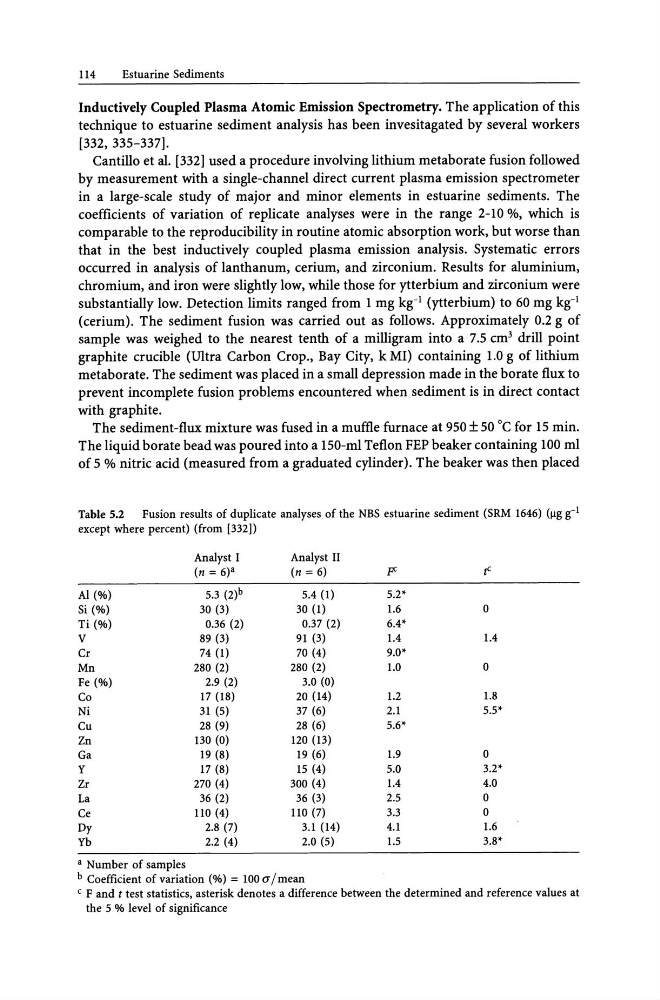
Cantillo et al. [332] used a procedure involving lithium metaborate fusion followed
by measurement with a single-channel direct current plasma emission spectrometer
in a large-scale study of major and minor elements in estuarine sediments. The
coefficients of variation of replicate analyses were in the range 2-10 %, which is
comparable to the reproducibility in routine atomic absorption work, but worse than
that in the best inductively coupled plasma emission analysis. Systematic errors
occurred in analysis of lanthanum, cerium, and zirconium. Results for aluminium,
chromium, and iron were slightly low, while those for ytterbium and zirconium were
substantially low. Detection limits ranged from 1 mg kg- 1 (ytterbium) to 60 mg kg- 1
(cerium). The sediment fusion was carried out as follows. Approximately 0.2 g of
sample was weighed to the nearest tenth of a milligram into a 7.5 cm 3 drill point
graphite crucible (Ultra Carbon Crop., Bay City, k MI) containing 1.0 g of lithium
metaborate. The sediment was placed in a small depression made in the borate flux to
prevent incomplete fusion problems encountered when sediment is in direct contact
with graphite.
The sediment-flux mixture was fused in a muffle furnace at 950 ± 50°C for 15 min.
The liquid borate bead was poured into a 150-ml Teflon FEP beaker containing 100 ml
of 5 % nitric acid (measured from a graduated cylinder). The beaker was then placed
Table 5.2
Fusion results of duplicate analyses of the NBS estuarine sediment (SRM 1646) (~g g-l
except where percent) (from [332])
Analyst I
Analyst II
(n = 6)'
(n = 6)
pc
t'
Al(%)
5.3 (2)b
5.4 (1)
5.2*
Si (%)
30 (3)
30 (1)
1.6
0
Ti (%)
0.36 (2)
0.37 (2)
6.4*
V
89 (3)
91 (3)
1.4
1.4
Cr
74 (1)
70 (4)
9.0*
Mn
280 (2)
280 (2)
1.0
0
Fe (%)
2.9 (2)
3.0 (0)
Co
17 (18)
20 (14)
1.2
1.8
Ni
31 (5)
37 (6)
2.1
5.5*
Cu
28 (9)
28 (6)
5.6*
Zn
130 (0)
120 (13)
Ga
19 (8)
19 (6)
1.9
0
Y
17 (8)
15 (4)
5.0
3.2*
Zr
270 (4)
300 (4)
1.4
4.0
La
36 (2)
36 (3)
2.5
0
Ce
110 (4)
110 (7)
3.3
0
Dy
2.8 (7)
3.1 (14)
4.1
1.6
Yb
2.2 (4)
2.0 (5)
1.5
3.8*
• Number of samples
b Coefficient of variation (%) = 100 (j / mean
C F and t test statistics, asterisk denotes a difference between the determined and reference values at
the 5 % level of significance
Estuarine Sediments
Inductively Coupled Plasma Atomic Emission Spectrometry. The application of this
technique to estuarine sediment analysis has been invesitagated by several workers
[332, 335-337].
Cantillo et al. [332] used a procedure involving lithium metaborate fusion followed
by measurement with a single-channel direct current plasma emission spectrometer
in a large-scale study of major and minor elements in estuarine sediments. The
coefficients of variation of replicate analyses were in the range 2-10 %, which is
comparable to the reproducibility in routine atomic absorption work, but worse than
that in the best inductively coupled plasma emission analysis. Systematic errors
occurred in analysis of lanthanum, cerium, and zirconium. Results for aluminium,
chromium, and iron were slightly low, while those for ytterbium and zirconium were
substantially low. Detection limits ranged from 1 mg kg- 1 (ytterbium) to 60 mg kg- 1
(cerium). The sediment fusion was carried out as follows. Approximately 0.2 g of
sample was weighed to the nearest tenth of a milligram into a 7.5 cm 3 drill point
graphite crucible (Ultra Carbon Crop., Bay City, k MI) containing 1.0 g of lithium
metaborate. The sediment was placed in a small depression made in the borate flux to
prevent incomplete fusion problems encountered when sediment is in direct contact
with graphite.
The sediment-flux mixture was fused in a muffle furnace at 950 ± 50°C for 15 min.
The liquid borate bead was poured into a 150-ml Teflon FEP beaker containing 100 ml
of 5 % nitric acid (measured from a graduated cylinder). The beaker was then placed
Table 5.2
Fusion results of duplicate analyses of the NBS estuarine sediment (SRM 1646) (~g g-l
except where percent) (from [332])
Analyst I
Analyst II
(n = 6)'
(n = 6)
pc
t'
Al(%)
5.3 (2)b
5.4 (1)
5.2*
Si (%)
30 (3)
30 (1)
1.6
0
Ti (%)
0.36 (2)
0.37 (2)
6.4*
V
89 (3)
91 (3)
1.4
1.4
Cr
74 (1)
70 (4)
9.0*
Mn
280 (2)
280 (2)
1.0
0
Fe (%)
2.9 (2)
3.0 (0)
Co
17 (18)
20 (14)
1.2
1.8
Ni
31 (5)
37 (6)
2.1
5.5*
Cu
28 (9)
28 (6)
5.6*
Zn
130 (0)
120 (13)
Ga
19 (8)
19 (6)
1.9
0
Y
17 (8)
15 (4)
5.0
3.2*
Zr
270 (4)
300 (4)
1.4
4.0
La
36 (2)
36 (3)
2.5
0
Ce
110 (4)
110 (7)
3.3
0
Dy
2.8 (7)
3.1 (14)
4.1
1.6
Yb
2.2 (4)
2.0 (5)
1.5
3.8*
• Number of samples
b Coefficient of variation (%) = 100 (j / mean
C F and t test statistics, asterisk denotes a difference between the determined and reference values at
the 5 % level of significance