

Metals
95
Table 4.4
Mineral components of the density sub fractions (from [273])
Density Sample ES 26
subfrac- (+ 10 !illl)
tion
< 2.40
Organics (9 wt %);
mostly organic debris; a few
soft white conglomerates of
magnesian calcite and quartz
2.40-2.55 Conglomerates (6 wt %);
soft white conglomerates of
magnesian calcite, quartz, a
little feldspar
2.55-2.66 Quartz + calcite shells
(46 wt %);
quartz and calcitic coralline
stems, hexagonal rods, microshells
2.66-2.75 Magnesian calcite shells
(20 wt %);
opaque white shell fragments
and whole microshells of magnesian calcite; some coralline
stems and tubes
2.75-2.95 Aragonite shells (19 wt %);
thin shiny shell fragments of
aragonite; some transparent
platelets
> 2.95
Heavy minerals (0.1 wt %);
as for ES 35
Sample ES 35
(+ 10!illl)
Mass balance I-lg
Pb
Cd
Zn
Clay conglomerates (8 wt %);
19.74 0.985 22.01
soft golden brown conglomerates of magnesian calcite, mica,
kaolin, quartz, and goethite; a
few black vitreous particles
Conglomerates (40 wt %);
5.74 0.325
7.l3
soft brown and off-white conglomerates of magnesian calcite,
mica, some kaolin, quartz, traces goethite, feldspar
Quartz + calcite shells (42 wt %); 11.04 0.470 18.12
mostly quartz; some calcitic
shell fragments, a few hexagonal rods
Magnesian calcite shells
6.64 0.585
9.23
(4 wt %);
as for ES 26 but including some
black particles of irregular shape
Aragonite shells (6 wt %);
2.33 0.194
3.58
as for ES 26
Heavy minerals (0.2 wt %);
Weight too small to
translucent brown and green
analyse
particles of tourmaline ilmenite,
opaque black particles of magnetite, opaque golden rounded
particles
Total 45.5
2.56
60.0
Unfractionated sample
45.5
2.36
72.4
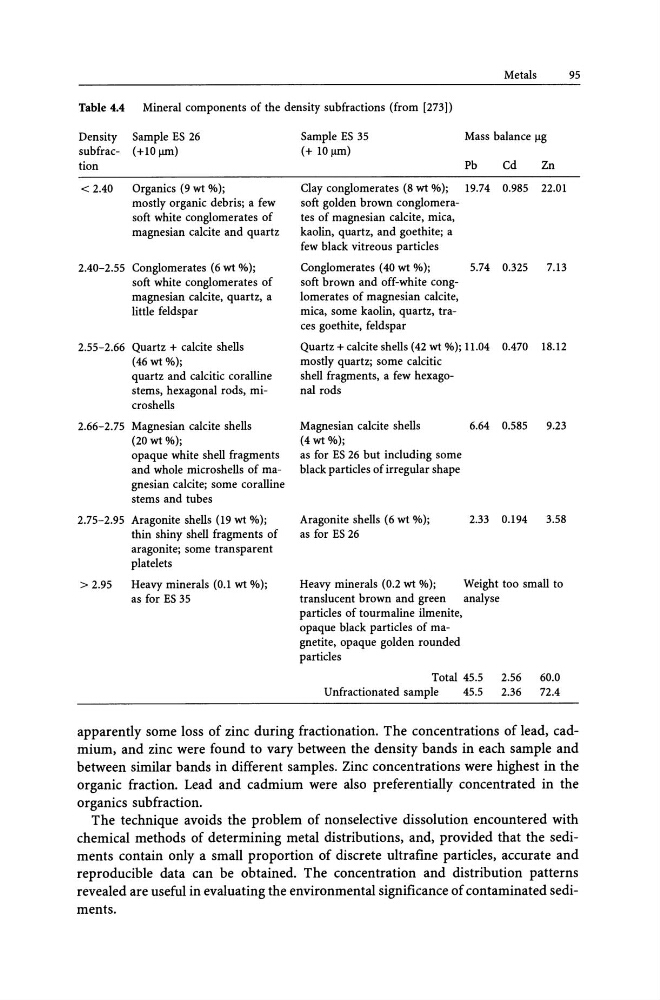
apparently some loss of zinc during fractionation. The concentrations of lead, cadmium, and zinc were found to vary between the density bands in each sample and
between similar bands in different samples. Zinc concentrations were highest in the
organic fraction. Lead and cadmium were also preferentially concentrated in the
organics sub fraction.
The technique avoids the problem of nonselective dissolution encountered with
chemical methods of determining metal distributions, and, provided that the sediments contain only a small proportion of discrete ultrafine particles, accurate and
reproducible data can be obtained. The concentration and distribution patterns
revealed are useful in evaluating the environmental significance of contaminated sediments.
95
Table 4.4
Mineral components of the density sub fractions (from [273])
Density Sample ES 26
subfrac- (+ 10 !illl)
tion
< 2.40
Organics (9 wt %);
mostly organic debris; a few
soft white conglomerates of
magnesian calcite and quartz
2.40-2.55 Conglomerates (6 wt %);
soft white conglomerates of
magnesian calcite, quartz, a
little feldspar
2.55-2.66 Quartz + calcite shells
(46 wt %);
quartz and calcitic coralline
stems, hexagonal rods, microshells
2.66-2.75 Magnesian calcite shells
(20 wt %);
opaque white shell fragments
and whole microshells of magnesian calcite; some coralline
stems and tubes
2.75-2.95 Aragonite shells (19 wt %);
thin shiny shell fragments of
aragonite; some transparent
platelets
> 2.95
Heavy minerals (0.1 wt %);
as for ES 35
Sample ES 35
(+ 10!illl)
Mass balance I-lg
Pb
Cd
Zn
Clay conglomerates (8 wt %);
19.74 0.985 22.01
soft golden brown conglomerates of magnesian calcite, mica,
kaolin, quartz, and goethite; a
few black vitreous particles
Conglomerates (40 wt %);
5.74 0.325
7.l3
soft brown and off-white conglomerates of magnesian calcite,
mica, some kaolin, quartz, traces goethite, feldspar
Quartz + calcite shells (42 wt %); 11.04 0.470 18.12
mostly quartz; some calcitic
shell fragments, a few hexagonal rods
Magnesian calcite shells
6.64 0.585
9.23
(4 wt %);
as for ES 26 but including some
black particles of irregular shape
Aragonite shells (6 wt %);
2.33 0.194
3.58
as for ES 26
Heavy minerals (0.2 wt %);
Weight too small to
translucent brown and green
analyse
particles of tourmaline ilmenite,
opaque black particles of magnetite, opaque golden rounded
particles
Total 45.5
2.56
60.0
Unfractionated sample
45.5
2.36
72.4
apparently some loss of zinc during fractionation. The concentrations of lead, cadmium, and zinc were found to vary between the density bands in each sample and
between similar bands in different samples. Zinc concentrations were highest in the
organic fraction. Lead and cadmium were also preferentially concentrated in the
organics sub fraction.
The technique avoids the problem of nonselective dissolution encountered with
chemical methods of determining metal distributions, and, provided that the sediments contain only a small proportion of discrete ultrafine particles, accurate and
reproducible data can be obtained. The concentration and distribution patterns
revealed are useful in evaluating the environmental significance of contaminated sediments.