

312
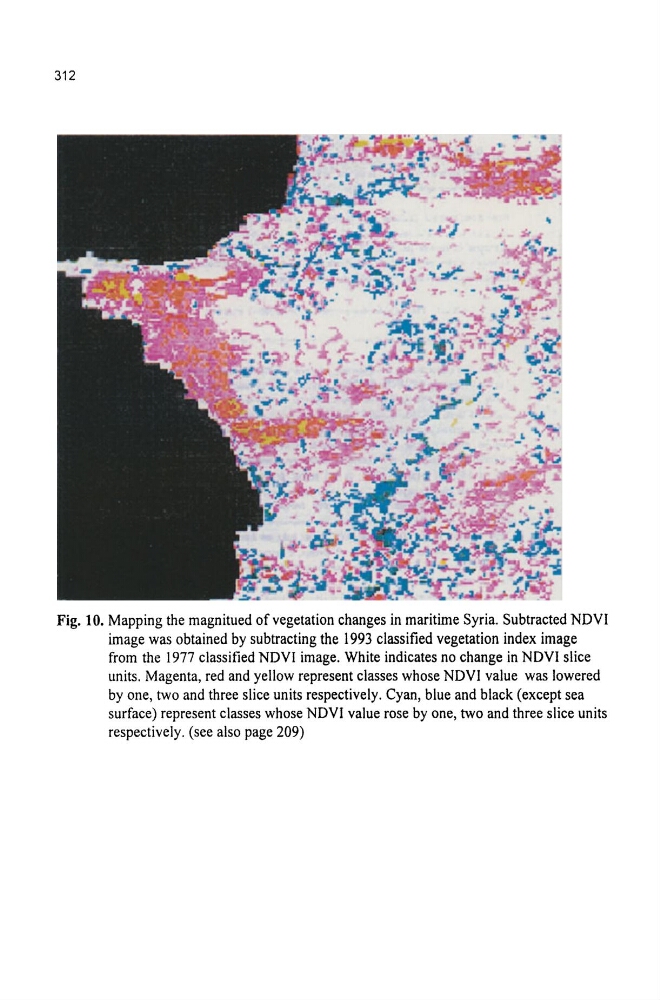
Fig. 10. Mapping the magnitued of vegetation changes in maritime Syria. Subtracted NDVI
image was obtained by subtracting the 1993 classified vegetation index image
from the 1977 classified NDVI image. White indicates no change in NDVI slice
units. Magenta, red and yellow represent classes whose NDVI value was lowered
by one, two and three slice units respectively. Cyan, blue and black (except sea
surface) represent classes whose NDVI value rose by one, two and three slice units
respectively. (see also page 209)
Fig. 10. Mapping the magnitued of vegetation changes in maritime Syria. Subtracted NDVI
image was obtained by subtracting the 1993 classified vegetation index image
from the 1977 classified NDVI image. White indicates no change in NDVI slice
units. Magenta, red and yellow represent classes whose NDVI value was lowered
by one, two and three slice units respectively. Cyan, blue and black (except sea
surface) represent classes whose NDVI value rose by one, two and three slice units
respectively. (see also page 209)