

188
Regional Environmental Changes: Application to Soil Erosion Modeling
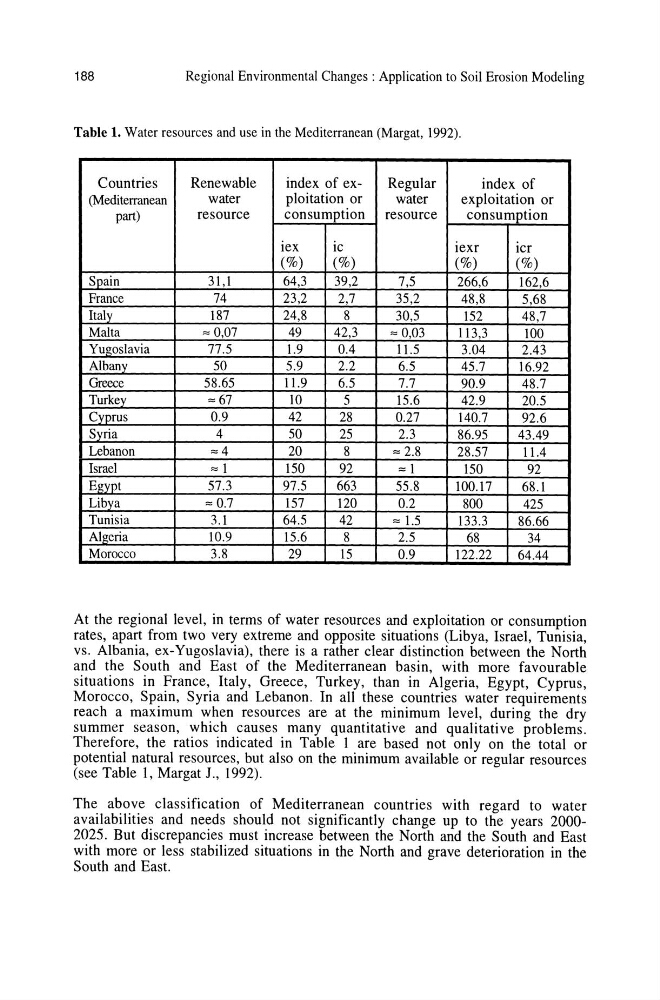
Table 1. Water resources and use in the Mediterranean (Margat, 1992).
Countries
Renewable
index of exRegular
index of
(Mediterranean
water
ploitation or
water
exploitation or
part)
resource
consumption resource
consumption
iex
ic
iexr
lcr
(%)
(%)
(%)
(%)
SQain
31,1
64,3
39,2
7,5
266,6
162,6
France
74
23,2
2,7
35,2
48,8
5,68
Italy
187
24,8
8
30,5
152
48,7
Malta
'" 0,07
49
42,3
'" 0,Q3
113,3
100
Yugoslavia
77.5
1.9
0.4
11.5
3.04
2.43
Albany
50
5.9
2.2
6.5
45.7
16.92
Greece
58.65
11.9
6.5
7.7
90.9
48.7
Turkey
'" 67
10
5
15.6
42.9
20.5
Cyprus
0.9
42
28
0.27
140.7
92.6
Syria
4
50
25
2.3
86.95
43.49
Lebanon
",4
20
8
'" 2.8
28.57
11.4
Israel
'" 1
150
92
'" 1
150
92
Egypt
57.3
97.5
663
55.8
100.17
68.1
Libya
'" 0.7
157
120
0.2
800
425
Tunisia
3.1
64.5
42
'" 1.5
133.3
86.66
Algeria
10.9
15.6
8
2.5
68
34
Morocco
3.8
29
15
0.9
122.22
64.44
At the regional level, in terms of water resources and exploitation or consumption
rates, apart from two very extreme and opposite situations (Libya, Israel, Tunisia,
vs. Albania, ex-Yugoslavia), there is a rather clear distinction between the North
and the South and East of the Mediterranean basin, with more favourable
situations in France, Italy, Greece, Turkey, than in Algeria, Egypt, Cyprus,
Morocco, Spain, Syria and Lebanon. In all these countries water requirements
reach a maximum when resources are at the minimum level, during the dry
summer season, which causes many quantitative and qualitative problems.
Therefore, the ratios indicated in Table 1 are based not only on the total or
potential natural resources, but also on the minimum available or regular resources
(see Table 1, Margat J., 1992).
The above classification of Mediterranean countries with regard to water
availabilities and needs should not significantly change up to the years 20002025. But discrepancies must increase between the North and the South and East
with more or less stabilized situations in the North and grave deterioration in the
South and East.
Regional Environmental Changes: Application to Soil Erosion Modeling
Table 1. Water resources and use in the Mediterranean (Margat, 1992).
Countries
Renewable
index of exRegular
index of
(Mediterranean
water
ploitation or
water
exploitation or
part)
resource
consumption resource
consumption
iex
ic
iexr
lcr
(%)
(%)
(%)
(%)
SQain
31,1
64,3
39,2
7,5
266,6
162,6
France
74
23,2
2,7
35,2
48,8
5,68
Italy
187
24,8
8
30,5
152
48,7
Malta
'" 0,07
49
42,3
'" 0,Q3
113,3
100
Yugoslavia
77.5
1.9
0.4
11.5
3.04
2.43
Albany
50
5.9
2.2
6.5
45.7
16.92
Greece
58.65
11.9
6.5
7.7
90.9
48.7
Turkey
'" 67
10
5
15.6
42.9
20.5
Cyprus
0.9
42
28
0.27
140.7
92.6
Syria
4
50
25
2.3
86.95
43.49
Lebanon
",4
20
8
'" 2.8
28.57
11.4
Israel
'" 1
150
92
'" 1
150
92
Egypt
57.3
97.5
663
55.8
100.17
68.1
Libya
'" 0.7
157
120
0.2
800
425
Tunisia
3.1
64.5
42
'" 1.5
133.3
86.66
Algeria
10.9
15.6
8
2.5
68
34
Morocco
3.8
29
15
0.9
122.22
64.44
At the regional level, in terms of water resources and exploitation or consumption
rates, apart from two very extreme and opposite situations (Libya, Israel, Tunisia,
vs. Albania, ex-Yugoslavia), there is a rather clear distinction between the North
and the South and East of the Mediterranean basin, with more favourable
situations in France, Italy, Greece, Turkey, than in Algeria, Egypt, Cyprus,
Morocco, Spain, Syria and Lebanon. In all these countries water requirements
reach a maximum when resources are at the minimum level, during the dry
summer season, which causes many quantitative and qualitative problems.
Therefore, the ratios indicated in Table 1 are based not only on the total or
potential natural resources, but also on the minimum available or regular resources
(see Table 1, Margat J., 1992).
The above classification of Mediterranean countries with regard to water
availabilities and needs should not significantly change up to the years 20002025. But discrepancies must increase between the North and the South and East
with more or less stabilized situations in the North and grave deterioration in the
South and East.