

1. Overview
31
-
I
-. j'"
UJ
c
E ..J
a.
::!:
c(
PART A
1--19±4
-IPART B
typically
24.5±3_L - - 1 9 ± 3 _ 1 5al60s
r
(hen
1 at 160s
o
10
20
30
40
50
TIME (seconds)
60
70
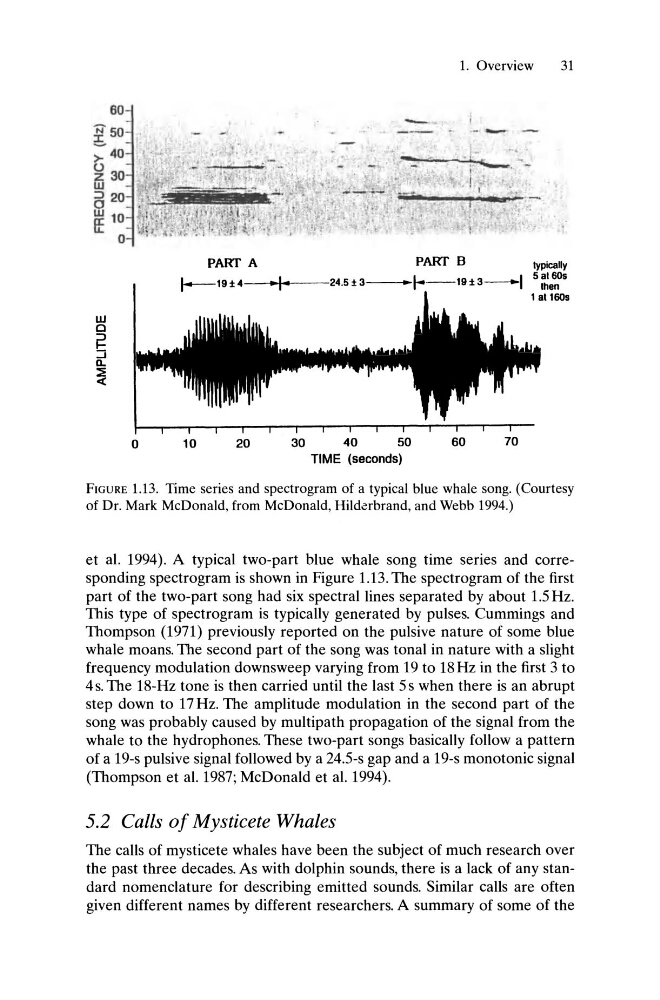
FIGURE 1.13. Time series and spectrogram of a typical blue whale song. (Courtesy
of Dr. Mark McDonald, from McDonald, Hild~rbrand, and Webb 1994.)
et aL 1994). A typical two-part blue whale song time series and corresponding spectrogram is shown in Figure 1.13. The spectrogram of the first
part of the two-part song had six spectral lines separated by about 1.5 Hz.
This type of spectrogram is typically generated by pulses. Cummings and
Thompson (1971) previously reported on the pulsive nature of some blue
whale moans. The second part of the song was tonal in nature with a slight
frequency modulation downsweep varying from 19 to 18Hz in the first 3 to
4s. The 18-Hz tone is then carried until the last 5 s when there is an abrupt
step down to 17 Hz. The amplitude modulation in the second part of the
song was probably caused by multipath propagation of the signal from the
whale to the hydrophones. These two-part songs basically follow a pattern
of a 19-s pulsive signal followed by a 24.5-s gap and a 19-s monotonic signal
(Thompson et aL 1987; McDonald et aL 1994).
5.2 Calls of Mysticete Whales
The calls of mysticete whales have been the subject of much research over
the past three decades. As with dolphin sounds, there is a lack of any standard nomenclature for describing emitted sounds. Similar calls are often
given different names by different researchers. A summary of some of the
31
-
I
-. j'"
UJ
c
E ..J
a.
::!:
c(
PART A
1--19±4
-IPART B
typically
24.5±3_L - - 1 9 ± 3 _ 1 5al60s
r
(hen
1 at 160s
o
10
20
30
40
50
TIME (seconds)
60
70
FIGURE 1.13. Time series and spectrogram of a typical blue whale song. (Courtesy
of Dr. Mark McDonald, from McDonald, Hild~rbrand, and Webb 1994.)
et aL 1994). A typical two-part blue whale song time series and corresponding spectrogram is shown in Figure 1.13. The spectrogram of the first
part of the two-part song had six spectral lines separated by about 1.5 Hz.
This type of spectrogram is typically generated by pulses. Cummings and
Thompson (1971) previously reported on the pulsive nature of some blue
whale moans. The second part of the song was tonal in nature with a slight
frequency modulation downsweep varying from 19 to 18Hz in the first 3 to
4s. The 18-Hz tone is then carried until the last 5 s when there is an abrupt
step down to 17 Hz. The amplitude modulation in the second part of the
song was probably caused by multipath propagation of the signal from the
whale to the hydrophones. These two-part songs basically follow a pattern
of a 19-s pulsive signal followed by a 24.5-s gap and a 19-s monotonic signal
(Thompson et aL 1987; McDonald et aL 1994).
5.2 Calls of Mysticete Whales
The calls of mysticete whales have been the subject of much research over
the past three decades. As with dolphin sounds, there is a lack of any standard nomenclature for describing emitted sounds. Similar calls are often
given different names by different researchers. A summary of some of the