

(A)
Laryngeal Source; Freq=75kHz; (6,IP)=(-31.8,48.5); DI=11.4dB
Above
Behind
t
J I
1\t~:::;,fCJ I IX
r' :J I I ".1 Behind
Below
(B)
Right Nasal Plug Source; Freq=75kHz; (6,IP)=(42.1,18.6); DI=14.6dB
Above
~
Behind
I I I III I I I I I
g. I I I Behind
Below
(C)
Left MLDB Source; Freq=75kHz; (6,IP)=(-2.5,-21.9); DI=14.1dB
Above
Behind
I I I III I'"
,~W 'I I
~,I
I I Behind
Below
(0)
Right MLDB Source; Freq=75kHz; (6,<\»=(4.8,'0.3); DI=14.6dB
Above
Behind
I I I
J!l I
1·~f.'.1
I
~
I I I Behind
~
0\
!-<
r
>
~
'"
::l
(1)
...
~
FIGURE
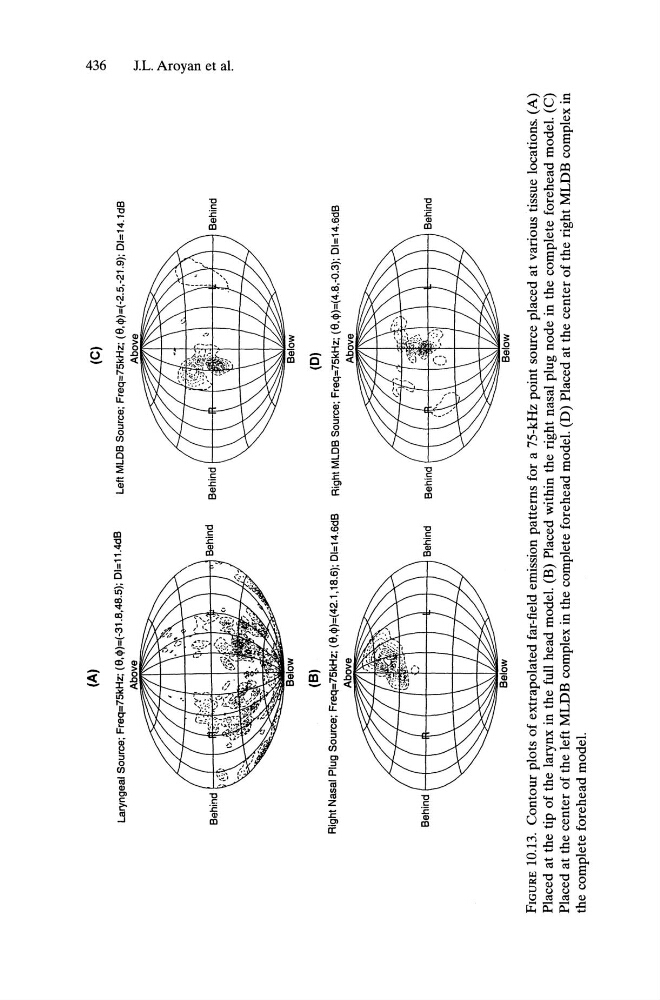
10.13. Contour plots of extrapolated far-field emission patterns for a 75-kHz point source placed at various tissue locations. (A)
Placed
at the tip of the larynx in the full head model. (B) Placed within the right nasal plug node in the complete forehead model. (C)
Placed
at the center of the left MLDB complex in the complete forehead model. (D) Placed at the center of the right MLDB complex in
the complete forehead model.
Laryngeal Source; Freq=75kHz; (6,IP)=(-31.8,48.5); DI=11.4dB
Above
Behind
t
J I
1\t~:::;,fCJ I IX
r' :J I I ".1 Behind
Below
(B)
Right Nasal Plug Source; Freq=75kHz; (6,IP)=(42.1,18.6); DI=14.6dB
Above
~
Behind
I I I III I I I I I
g. I I I Behind
Below
(C)
Left MLDB Source; Freq=75kHz; (6,IP)=(-2.5,-21.9); DI=14.1dB
Above
Behind
I I I III I'"
,~W 'I I
~,I
I I Behind
Below
(0)
Right MLDB Source; Freq=75kHz; (6,<\»=(4.8,'0.3); DI=14.6dB
Above
Behind
I I I
J!l I
1·~f.'.1
I
~
I I I Behind
~
0\
!-<
r
>
~
'"
::l
(1)
...
~
FIGURE
10.13. Contour plots of extrapolated far-field emission patterns for a 75-kHz point source placed at various tissue locations. (A)
Placed
at the tip of the larynx in the full head model. (B) Placed within the right nasal plug node in the complete forehead model. (C)
Placed
at the center of the left MLDB complex in the complete forehead model. (D) Placed at the center of the right MLDB complex in
the complete forehead model.