

10. Acoustic Models of Sound Production
421
x
A
Right MLDB
z
y
x
Left Ear maximum
Right Ear maximum
B
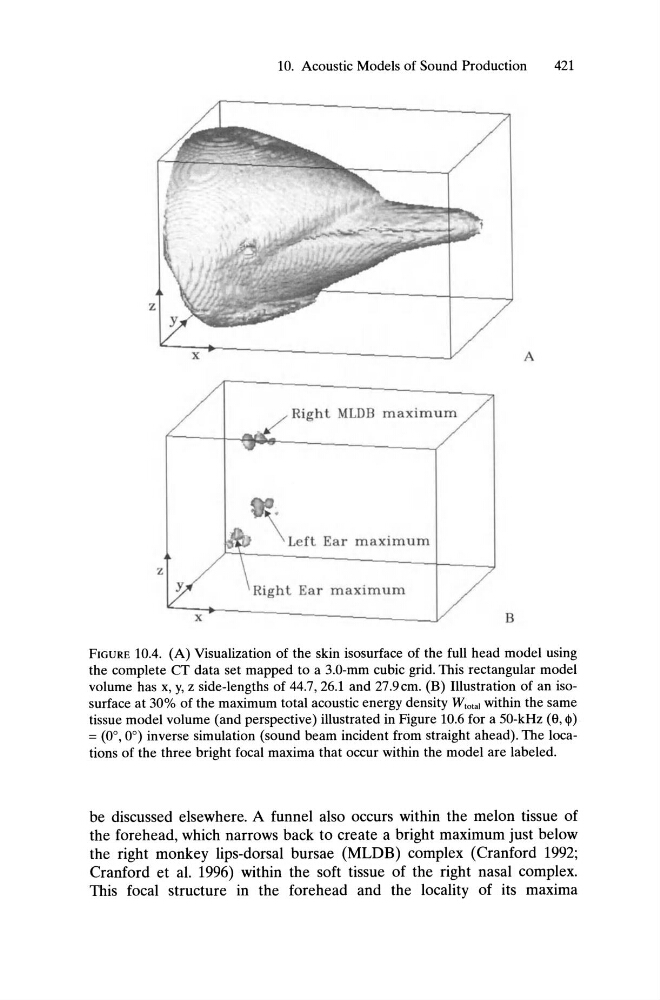
FIGURE 10.4. (A) Visualization of the skin isosurface of the full head model using
the complete cr data set mapped to a 3.0-mm cubic grid. This rectangular model
volume has x, y, z side-lengths of 44.7, 26.1 and 27.9cm. (B) Illustration of an isosurface at 30% of the maximum total acoustic energy density Wtotal within the same
tissue model volume (and perspective) illustrated in Figure 10.6 for a 50-kHz (8, ep)
= (0°,0°) inverse simulation (sound beam incident from straight ahead). The locations of the three bright focal maxima that occur within the model are labeled.
be discussed elsewhere. A funnel also occurs within the melon tissue of
the forehead, which narrows back to create a bright maximum just below
the right monkey lips-dorsal bursae (MLDB) complex (Cranford 1992;
Cranford et al. 1996) within the soft tissue of the right nasal complex.
This focal structure in the forehead and the locality of its maxima
421
x
A
Right MLDB
z
y
x
Left Ear maximum
Right Ear maximum
B
FIGURE 10.4. (A) Visualization of the skin isosurface of the full head model using
the complete cr data set mapped to a 3.0-mm cubic grid. This rectangular model
volume has x, y, z side-lengths of 44.7, 26.1 and 27.9cm. (B) Illustration of an isosurface at 30% of the maximum total acoustic energy density Wtotal within the same
tissue model volume (and perspective) illustrated in Figure 10.6 for a 50-kHz (8, ep)
= (0°,0°) inverse simulation (sound beam incident from straight ahead). The locations of the three bright focal maxima that occur within the model are labeled.
be discussed elsewhere. A funnel also occurs within the melon tissue of
the forehead, which narrows back to create a bright maximum just below
the right monkey lips-dorsal bursae (MLDB) complex (Cranford 1992;
Cranford et al. 1996) within the soft tissue of the right nasal complex.
This focal structure in the forehead and the locality of its maxima