

7. Electrophysiological Techniques
321
frequency channel is synchronized to the modulation period of the
amplitude-modulated stimulus. Masking studies (e.g., Dolphin and
Mountain 1993; Dolphin et al. 1994) have demonstrated that the response
arises from a small frequency region corresponding to the stimulus
frequency and not to the modulation frequency. In addition to the frequency specificity of this technique, an added advantage is the ability to test
at low stimulus frequencies, at least down to the 100 to 200 Hz range.
Low-frequency audiograms have been obtained from several cetacean
species, including T. truncatus, P crassidens, G. griseus and D. leucas, using
the EFR technique (Dolphin et al. 1995). Two approaches have been used
in these studies. In the first, a single amplitude-modulated signal is presented and the response evaluated; thus, frequencies were tested one at a
time. In the second approach, based on the results of the multienvelope
experiments described previously, multiple amplitude-modulated tones
were presented simultaneously. In this approach, up to three frequencies
were tested at a time.
An added advantage of the EFR technique is that the presence or
absence of a response to a particular stimulus frequency may be based on
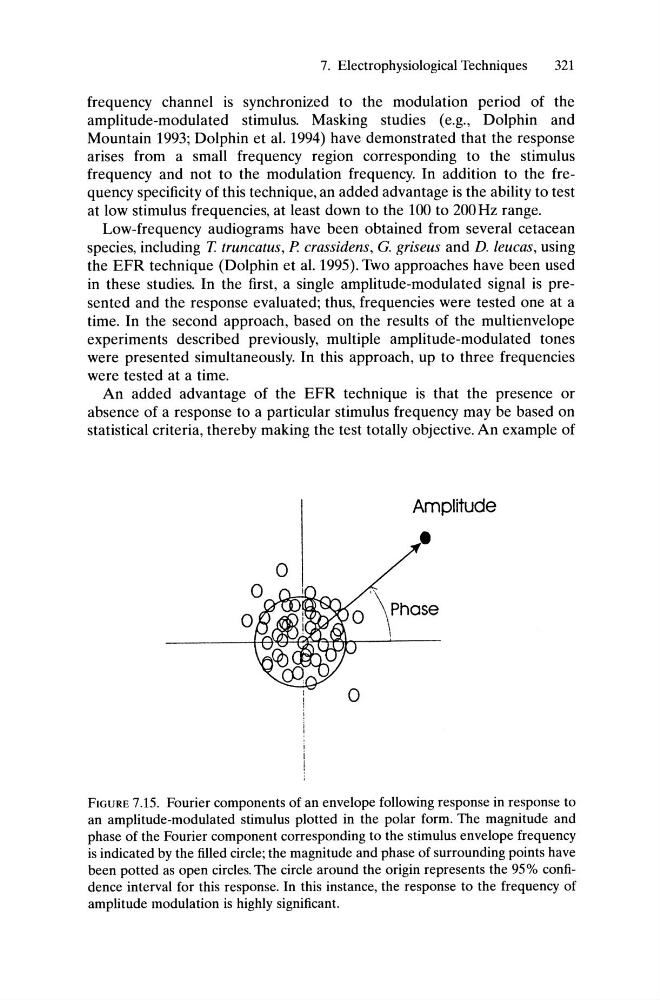
statistical criteria, thereby making the test totally objective. An example of
Amplitude
•
o
FIGURE 7.15. Fourier components of an envelope following response in response to
an amplitude-modulated stimulus plotted in the polar form. The magnitude and
phase of the Fourier component corresponding to the stimulus envelope frequency
is indicated by the filled circle; the magnitude and phase of surrounding points have
been potted as open circles. The circle around the origin represents the 95% confidence interval for this response. In this instance, the response to the frequency of
amplitude modulation is highly significant.
321
frequency channel is synchronized to the modulation period of the
amplitude-modulated stimulus. Masking studies (e.g., Dolphin and
Mountain 1993; Dolphin et al. 1994) have demonstrated that the response
arises from a small frequency region corresponding to the stimulus
frequency and not to the modulation frequency. In addition to the frequency specificity of this technique, an added advantage is the ability to test
at low stimulus frequencies, at least down to the 100 to 200 Hz range.
Low-frequency audiograms have been obtained from several cetacean
species, including T. truncatus, P crassidens, G. griseus and D. leucas, using
the EFR technique (Dolphin et al. 1995). Two approaches have been used
in these studies. In the first, a single amplitude-modulated signal is presented and the response evaluated; thus, frequencies were tested one at a
time. In the second approach, based on the results of the multienvelope
experiments described previously, multiple amplitude-modulated tones
were presented simultaneously. In this approach, up to three frequencies
were tested at a time.
An added advantage of the EFR technique is that the presence or
absence of a response to a particular stimulus frequency may be based on
statistical criteria, thereby making the test totally objective. An example of
Amplitude
•
o
FIGURE 7.15. Fourier components of an envelope following response in response to
an amplitude-modulated stimulus plotted in the polar form. The magnitude and
phase of the Fourier component corresponding to the stimulus envelope frequency
is indicated by the filled circle; the magnitude and phase of surrounding points have
been potted as open circles. The circle around the origin represents the 95% confidence interval for this response. In this instance, the response to the frequency of
amplitude modulation is highly significant.