

318
W.E Dolphin
quite complex and time consuming. Frequency tuning curves have been
obtained by Russian researchers (Supin and Popov 1995a) using the ABR
in conjunction with tone-on-tone masking.
In these studies an ABR was evoked using a brief tone burst at frequencies that varied between 16 and 128kHz. Probe stimuli were cosineshaped tone bursts (i.e., the envelope of the stimulus waveform was one
period of a function 1 + cos(t)) to minimize the bandwidth of the signal.
While the probe stimulus was presented at a constant frequency and intensity, a continuous-tone masker signal was simultaneously presented. The
intensity and frequency of the masker was varied. For each masker frequency the level required for near-complete masking of the response to
probe the signal was determined by visual inspection of ABR waveforms.
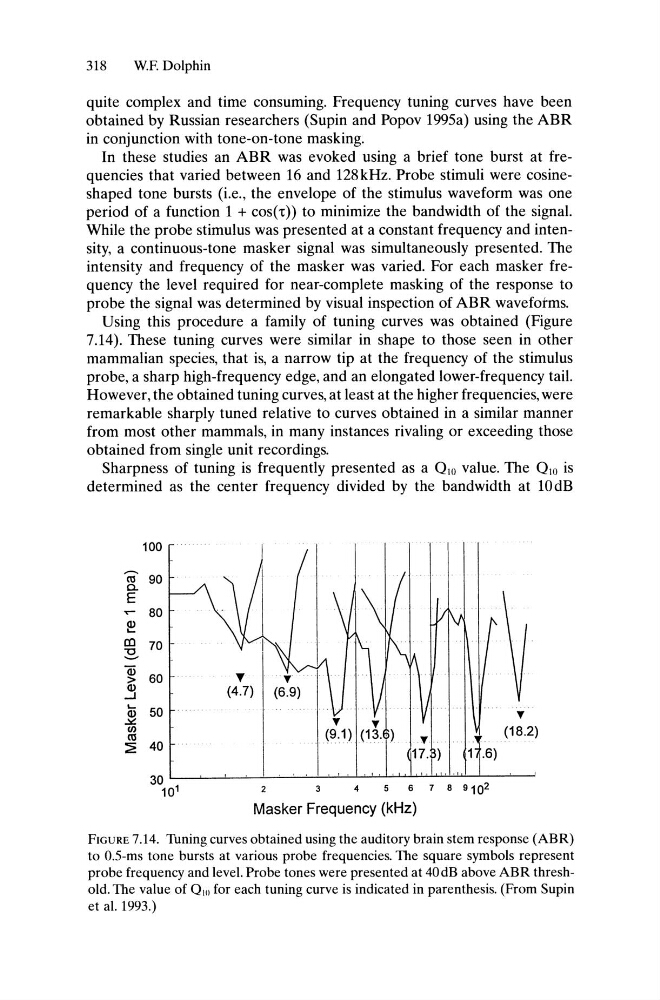
Using this procedure a family of tuning curves was obtained (Figure
7.14). These tuning curves were similar in shape to those seen in other
mammalian species, that is, a narrow tip at the frequency of the stimulus
probe, a sharp high-frequency edge, and an elongated lower-frequency tail.
However, the obtained tuning curves, at least at the higher frequencies, were
remarkable sharply tuned relative to curves obtained in a similar manner
from most other mammals, in many instances rivaling or exceeding those
obtained from single unit recordings.
Sharpness of tuning is frequently presented as a Ow value. The Ow is
determined as the center frequency divided by the bandwidth at 10dB
100
...... 90
ro
a.
E
..- 80
Q)
~
co 70
~
Q) 60
>
Q)
...J
.... 50
Q)
~
(/)
ro
:2: 40
30
10
1
T
(4.7)
T
(18.2)
.6)
4
5
6
7 8 910 2
Masker Frequency (kHz)
FIGURE 7.14. Tuning curves obtained using the auditory brain stem response (ABR)
to O.S-ms tone bursts at various probe frequencies. The square symbols represent
probe frequency and level. Probe tones were presented at 40dB above ABR threshold. The value of 0 10 for each tuning curve is indicated in parenthesis. (From Supin
et al. 1993.)
W.E Dolphin
quite complex and time consuming. Frequency tuning curves have been
obtained by Russian researchers (Supin and Popov 1995a) using the ABR
in conjunction with tone-on-tone masking.
In these studies an ABR was evoked using a brief tone burst at frequencies that varied between 16 and 128kHz. Probe stimuli were cosineshaped tone bursts (i.e., the envelope of the stimulus waveform was one
period of a function 1 + cos(t)) to minimize the bandwidth of the signal.
While the probe stimulus was presented at a constant frequency and intensity, a continuous-tone masker signal was simultaneously presented. The
intensity and frequency of the masker was varied. For each masker frequency the level required for near-complete masking of the response to
probe the signal was determined by visual inspection of ABR waveforms.
Using this procedure a family of tuning curves was obtained (Figure
7.14). These tuning curves were similar in shape to those seen in other
mammalian species, that is, a narrow tip at the frequency of the stimulus
probe, a sharp high-frequency edge, and an elongated lower-frequency tail.
However, the obtained tuning curves, at least at the higher frequencies, were
remarkable sharply tuned relative to curves obtained in a similar manner
from most other mammals, in many instances rivaling or exceeding those
obtained from single unit recordings.
Sharpness of tuning is frequently presented as a Ow value. The Ow is
determined as the center frequency divided by the bandwidth at 10dB
100
...... 90
ro
a.
E
..- 80
Q)
~
co 70
~
Q) 60
>
Q)
...J
.... 50
Q)
~
(/)
ro
:2: 40
30
10
1
T
(4.7)
T
(18.2)
.6)
4
5
6
7 8 910 2
Masker Frequency (kHz)
FIGURE 7.14. Tuning curves obtained using the auditory brain stem response (ABR)
to O.S-ms tone bursts at various probe frequencies. The square symbols represent
probe frequency and level. Probe tones were presented at 40dB above ABR threshold. The value of 0 10 for each tuning curve is indicated in parenthesis. (From Supin
et al. 1993.)