

4
W.W.L.Au
idae (gray whale), Balaenopteridae (Minke, sei, Bryde's, blue, fin, and humpback whales), and Neobalaenidae (pygmy right whale).
Acoustics play an important role in the life of all cetaceans, no matter
their size or location in the world. Underwater visibility is limited to tens
of meters under the best conditions and less than a fraction of a meter in
turbid and murky waters. Visibility is also limited by the lack of light at great
depths during the day and at almost any depth on a moonless night.
Acoustic energy propagates underwater better than any form of energy,
making it ideal for life in an aquatic environment. Whales and dolphins emit
a wide variety of different types of signals, utilizing a frequency range from
about 15Hz used by blue and fin whales to over 100kHz used by a number
of odontocetes when echolocating and emitting burst pulses.
The general rule of thumb is that larger animals tend to emit lower frequency sounds and the frequency range utilized by a specific species may
be dictated more from anatomical constraints than any other factors. If
some sort of resonance is involved in the generation process then anatomical dimensions become critical, that is, larger volumes resonant at lower
frequencies than smaller volumes. The use of a particular frequency band
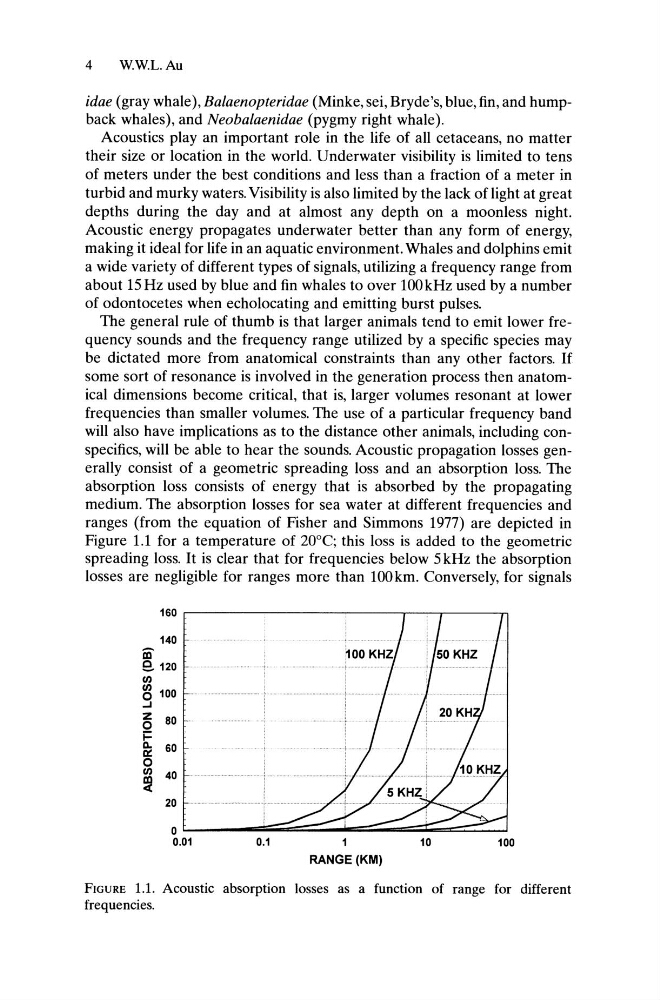
will also have implications as to the distance other animals, including conspecifics, will be able to hear the sounds. Acoustic propagation losses generally consist of a geometric spreading loss and an absorption loss. The
absorption loss consists of energy that is absorbed by the propagating
medium. The absorption losses for sea water at different frequencies and
ranges (from the equation of Fisher and Simmons 1977) are depicted in
Figure 1.1 for a temperature of 20°C; this loss is added to the geometric
spreading loss. It is clear that for frequencies below 5 kHz the absorption
losses are negligible for ranges more than 100km. Conversely, for signals
100
10
1
RANGE (KM)
0.1
20 1+
/ + . j
160
140
.. ;.
Iii'
e. 120
fI)
~ 100
..J
Z
80
0
i=
Q.
60
It
0
fI)
40
~
FIGURE 1.1. Acoustic absorption losses as a function of range for different
frequencies.
W.W.L.Au
idae (gray whale), Balaenopteridae (Minke, sei, Bryde's, blue, fin, and humpback whales), and Neobalaenidae (pygmy right whale).
Acoustics play an important role in the life of all cetaceans, no matter
their size or location in the world. Underwater visibility is limited to tens
of meters under the best conditions and less than a fraction of a meter in
turbid and murky waters. Visibility is also limited by the lack of light at great
depths during the day and at almost any depth on a moonless night.
Acoustic energy propagates underwater better than any form of energy,
making it ideal for life in an aquatic environment. Whales and dolphins emit
a wide variety of different types of signals, utilizing a frequency range from
about 15Hz used by blue and fin whales to over 100kHz used by a number
of odontocetes when echolocating and emitting burst pulses.
The general rule of thumb is that larger animals tend to emit lower frequency sounds and the frequency range utilized by a specific species may
be dictated more from anatomical constraints than any other factors. If
some sort of resonance is involved in the generation process then anatomical dimensions become critical, that is, larger volumes resonant at lower
frequencies than smaller volumes. The use of a particular frequency band
will also have implications as to the distance other animals, including conspecifics, will be able to hear the sounds. Acoustic propagation losses generally consist of a geometric spreading loss and an absorption loss. The
absorption loss consists of energy that is absorbed by the propagating
medium. The absorption losses for sea water at different frequencies and
ranges (from the equation of Fisher and Simmons 1977) are depicted in
Figure 1.1 for a temperature of 20°C; this loss is added to the geometric
spreading loss. It is clear that for frequencies below 5 kHz the absorption
losses are negligible for ranges more than 100km. Conversely, for signals
100
10
1
RANGE (KM)
0.1
20 1+
/ + . j
160
140
.. ;.
Iii'
e. 120
fI)
~ 100
..J
Z
80
0
i=
Q.
60
It
0
fI)
40
~
FIGURE 1.1. Acoustic absorption losses as a function of range for different
frequencies.