

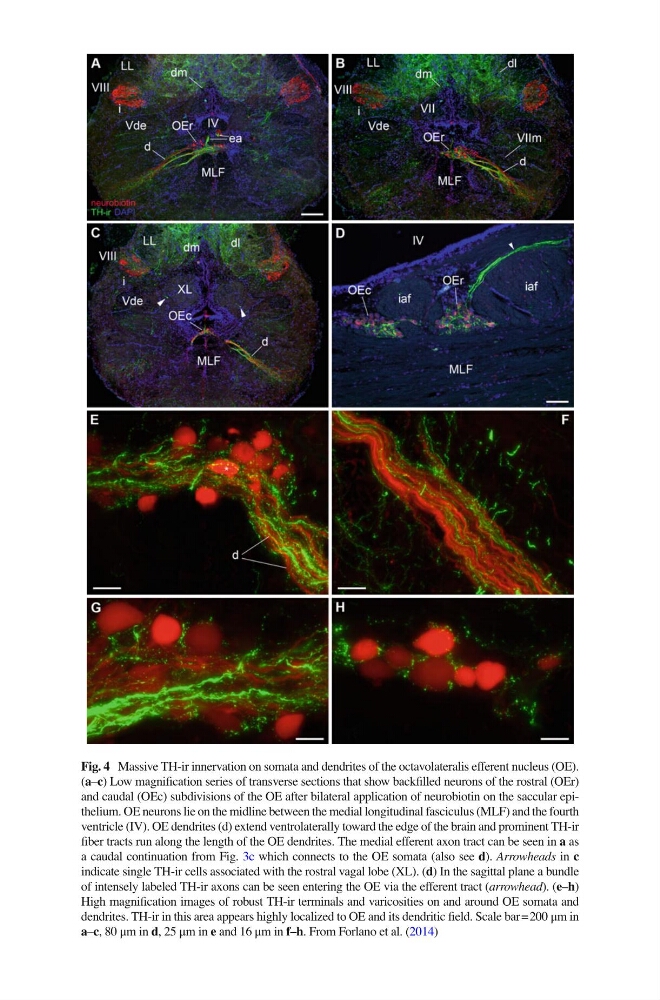
Fig. 4 Massive TH-ir innervation on somata and dendrites of the octavolateralis efferent nucleus (OE).
( a – c ) Low magnifi cation series of transverse sections that show backfi lled neurons of the rostral (OEr)
and caudal (OEc) subdivisions of the OE after bilateral application of neurobiotin on the saccular epithelium. OE neurons lie on the midline between the medial longitudinal fasciculus (MLF) and the fourth
ventricle (IV). OE dendrites (d) extend ventrolaterally toward the edge of the brain and prominent TH-ir
fi ber tracts run along the length of the OE dendrites. The medial efferent axon tract can be seen in a as
a caudal continuation from Fig. 3c which connects to the OE somata (also see d ). Arrowheads in c
indicate single TH-ir cells associated with the rostral vagal lobe (XL). ( d ) In the sagittal plane a bundle
of intensely labeled TH-ir axons can be seen entering the OE via the efferent tract ( arrowhead ). ( e – h )
High magnifi cation images of robust TH-ir terminals and varicosities on and around OE somata and
dendrites. TH-ir in this area appears highly localized to OE and its dendritic fi eld. Scale bar = 200 μm in
a – c , 80 μm in d , 25 μm in e and 16 μm in f–h . From Forlano et al. ( 2014 )
( a – c ) Low magnifi cation series of transverse sections that show backfi lled neurons of the rostral (OEr)
and caudal (OEc) subdivisions of the OE after bilateral application of neurobiotin on the saccular epithelium. OE neurons lie on the midline between the medial longitudinal fasciculus (MLF) and the fourth
ventricle (IV). OE dendrites (d) extend ventrolaterally toward the edge of the brain and prominent TH-ir
fi ber tracts run along the length of the OE dendrites. The medial efferent axon tract can be seen in a as
a caudal continuation from Fig. 3c which connects to the OE somata (also see d ). Arrowheads in c
indicate single TH-ir cells associated with the rostral vagal lobe (XL). ( d ) In the sagittal plane a bundle
of intensely labeled TH-ir axons can be seen entering the OE via the efferent tract ( arrowhead ). ( e – h )
High magnifi cation images of robust TH-ir terminals and varicosities on and around OE somata and
dendrites. TH-ir in this area appears highly localized to OE and its dendritic fi eld. Scale bar = 200 μm in
a – c , 80 μm in d , 25 μm in e and 16 μm in f–h . From Forlano et al. ( 2014 )