

408
( Pagrus auratus ) to an acoustic stimulus that mimicked a passing seismic vessel.
They found considerably more holes in the saccular epithelia at 58 compared to 18
days post-exposure suggesting that the process of sensory hair cell death and
regeneration is very slow in this species. As no hearing tests were done on these fi sh,
it is impossible to say whether the hair cell loss caused hearing loss, but other studies have shown a strong relationship between saccular hair cell loss and hearing loss
(Smith et al. 2011 ; Smith 2012 ). As other studies discussed previously show postacoustic trauma recovery of hair cells and hearing within approximately 2 weeks, it
is unclear why the snapper still exhibited signifi cant hair cell damage after 58 days,
but it may have been the result of the intensity of the seismic stimulus.
The time course of recovery following ototoxic damage in fi sh ears has only
been investigated in one study. Faucher et al. ( 2009 ) examined hair cell damage and
functional recovery in Atlantic cod ( Gadus morhua ) given intrasaccular injections
of gentamicin. They found that hair cell densities returned to control levels 14 days
post-injection (dpi), although average hair cell kinocilia length was still shorter than
normal at 21 dpi, suggesting that newly formed hair cells may still be growing. AEP
hearing thresholds returned to normal at 17 dpi.
While lost auditory hair cells appear to take a few weeks to completely recover
in the inner ear of fi shes, neuromasts and their associated hair cells in the lateral line
system recover much more quickly. For example, larval zebrafi sh briefl y exposed to
neomycin or dissolved copper recovered their hair cell numbers within 48–72 h as
a result of supporting cell proliferation and then differentiation into hair cells
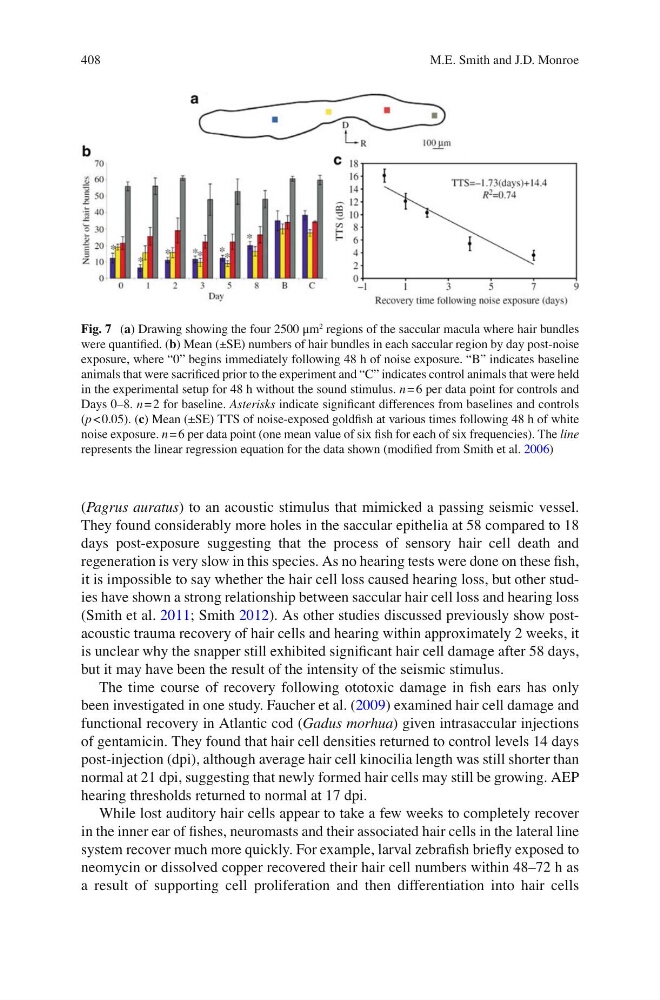
Fig. 7 ( a ) Drawing showing the four 2500 μm
2 regions of the saccular macula where hair bundles
were quantifi ed. ( b ) Mean (±SE) numbers of hair bundles in each saccular region by day post-noise
exposure, where “0” begins immediately following 48 h of noise exposure. “B” indicates baseline
animals that were sacrifi ced prior to the experiment and “C” indicates control animals that were held
in the experimental setup for 48 h without the sound stimulus. n = 6 per data point for controls and
Days 0–8. n = 2 for baseline. Asterisks indicate signifi cant differences from baselines and controls
( p < 0.05). ( c ) Mean (±SE) TTS of noise-exposed goldfi sh at various times following 48 h of white
noise exposure. n = 6 per data point (one mean value of six fi sh for each of six frequencies). The line
represents the linear regression equation for the data shown (modifi ed from Smith et al. 2006 )
M.E. Smith and J.D. Monroe
( Pagrus auratus ) to an acoustic stimulus that mimicked a passing seismic vessel.
They found considerably more holes in the saccular epithelia at 58 compared to 18
days post-exposure suggesting that the process of sensory hair cell death and
regeneration is very slow in this species. As no hearing tests were done on these fi sh,
it is impossible to say whether the hair cell loss caused hearing loss, but other studies have shown a strong relationship between saccular hair cell loss and hearing loss
(Smith et al. 2011 ; Smith 2012 ). As other studies discussed previously show postacoustic trauma recovery of hair cells and hearing within approximately 2 weeks, it
is unclear why the snapper still exhibited signifi cant hair cell damage after 58 days,
but it may have been the result of the intensity of the seismic stimulus.
The time course of recovery following ototoxic damage in fi sh ears has only
been investigated in one study. Faucher et al. ( 2009 ) examined hair cell damage and
functional recovery in Atlantic cod ( Gadus morhua ) given intrasaccular injections
of gentamicin. They found that hair cell densities returned to control levels 14 days
post-injection (dpi), although average hair cell kinocilia length was still shorter than
normal at 21 dpi, suggesting that newly formed hair cells may still be growing. AEP
hearing thresholds returned to normal at 17 dpi.
While lost auditory hair cells appear to take a few weeks to completely recover
in the inner ear of fi shes, neuromasts and their associated hair cells in the lateral line
system recover much more quickly. For example, larval zebrafi sh briefl y exposed to
neomycin or dissolved copper recovered their hair cell numbers within 48–72 h as
a result of supporting cell proliferation and then differentiation into hair cells
Fig. 7 ( a ) Drawing showing the four 2500 μm
2 regions of the saccular macula where hair bundles
were quantifi ed. ( b ) Mean (±SE) numbers of hair bundles in each saccular region by day post-noise
exposure, where “0” begins immediately following 48 h of noise exposure. “B” indicates baseline
animals that were sacrifi ced prior to the experiment and “C” indicates control animals that were held
in the experimental setup for 48 h without the sound stimulus. n = 6 per data point for controls and
Days 0–8. n = 2 for baseline. Asterisks indicate signifi cant differences from baselines and controls
( p < 0.05). ( c ) Mean (±SE) TTS of noise-exposed goldfi sh at various times following 48 h of white
noise exposure. n = 6 per data point (one mean value of six fi sh for each of six frequencies). The line
represents the linear regression equation for the data shown (modifi ed from Smith et al. 2006 )
M.E. Smith and J.D. Monroe