

283
3.4 The Lateral Line
The toadfi sh anterior lateral line responds to water fl ow, opercular displacement,
prey movements, and swimming (Palmer et al. 2005 ; Palmer and Mensinger 2004 ).
Although otoliths organs may be too close to use interaural time differences, the
mechanosensory lateral has widely spaced neuromasts that may encode suffi cient
time delays for sound localization. The location, innervation, and morphological
type of the neuromasts in the toadfi sh anterior lateral line has been established
(Clapp 1891 ; Pankratz 1930 ). In comparison with other teleosts, the anterior lateral
canals are reduced, with only 20 external canal pores on each side of the head. The
superfi cial neuromasts ( N = ~ 40 per side) are surrounded by paired fi nger like projections with the hair cells aligned perpendicular to the appendages, consequently
the directional sensitivity of the neuromasts can be predicted by external morphology (Marranzino et al. 2013 ).
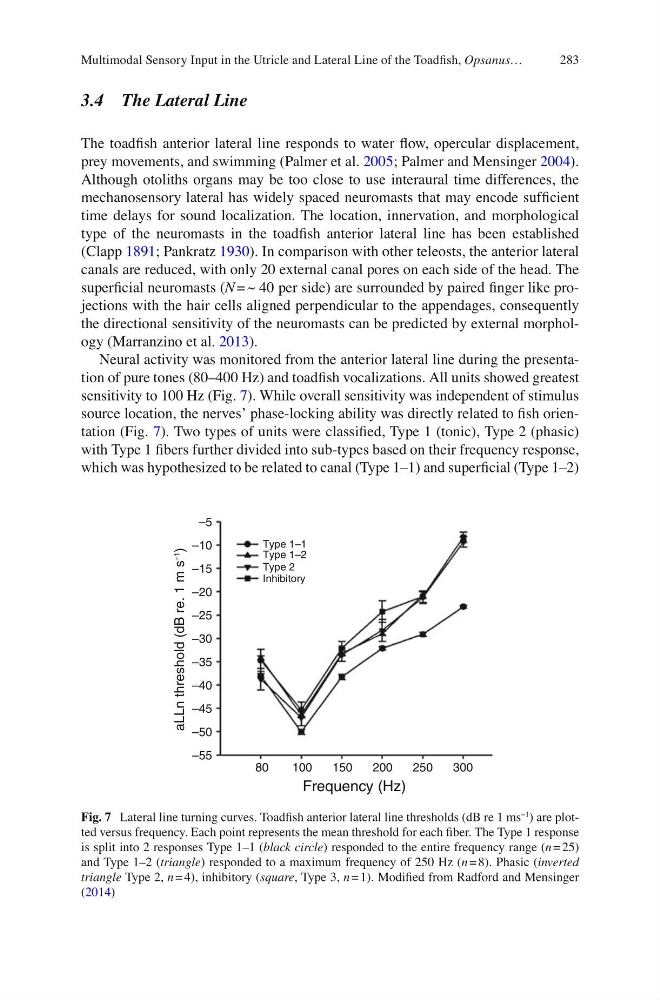
Neural activity was monitored from the anterior lateral line during the presentation of pure tones (80–400 Hz) and toadfi sh vocalizations. All units showed greatest
sensitivity to 100 Hz (Fig. 7 ). While overall sensitivity was independent of stimulus
source location, the nerves’ phase-locking ability was directly related to fi sh orientation (Fig. 7 ). Two types of units were classifi ed, Type 1 (tonic), Type 2 (phasic)
with Type 1 fi bers further divided into sub-types based on their frequency response,
which was hypothesized to be related to canal (Type 1–1) and superfi cial (Type 1–2)
80
–55
–50
–45
–40
–35
–30
–25
–20
–15
–10
–5
Type 1–1
Type 1–2
Type 2
Inhibitory
aLLn threshold (dB re. 1 m s
–1
)
100
150
Frequency (Hz)
200
250
300
Fig. 7 Lateral line turning curves. Toadfi sh anterior lateral line thresholds (dB re 1 ms
−1 ) are plotted versus frequency. Each point represents the mean threshold for each fi ber. The Type 1 response
is split into 2 responses Type 1–1 ( black circle ) responded to the entire frequency range ( n = 25)
and Type 1–2 ( triangle ) responded to a maximum frequency of 250 Hz ( n = 8). Phasic ( inverted
triangle Type 2, n = 4), inhibitory ( square , Type 3, n = 1). Modifi ed from Radford and Mensinger
( 2014 )
Multimodal Sensory Input in the Utricle and Lateral Line of the Toadfi sh, Opsanus…
3.4 The Lateral Line
The toadfi sh anterior lateral line responds to water fl ow, opercular displacement,
prey movements, and swimming (Palmer et al. 2005 ; Palmer and Mensinger 2004 ).
Although otoliths organs may be too close to use interaural time differences, the
mechanosensory lateral has widely spaced neuromasts that may encode suffi cient
time delays for sound localization. The location, innervation, and morphological
type of the neuromasts in the toadfi sh anterior lateral line has been established
(Clapp 1891 ; Pankratz 1930 ). In comparison with other teleosts, the anterior lateral
canals are reduced, with only 20 external canal pores on each side of the head. The
superfi cial neuromasts ( N = ~ 40 per side) are surrounded by paired fi nger like projections with the hair cells aligned perpendicular to the appendages, consequently
the directional sensitivity of the neuromasts can be predicted by external morphology (Marranzino et al. 2013 ).
Neural activity was monitored from the anterior lateral line during the presentation of pure tones (80–400 Hz) and toadfi sh vocalizations. All units showed greatest
sensitivity to 100 Hz (Fig. 7 ). While overall sensitivity was independent of stimulus
source location, the nerves’ phase-locking ability was directly related to fi sh orientation (Fig. 7 ). Two types of units were classifi ed, Type 1 (tonic), Type 2 (phasic)
with Type 1 fi bers further divided into sub-types based on their frequency response,
which was hypothesized to be related to canal (Type 1–1) and superfi cial (Type 1–2)
80
–55
–50
–45
–40
–35
–30
–25
–20
–15
–10
–5
Type 1–1
Type 1–2
Type 2
Inhibitory
aLLn threshold (dB re. 1 m s
–1
)
100
150
Frequency (Hz)
200
250
300
Fig. 7 Lateral line turning curves. Toadfi sh anterior lateral line thresholds (dB re 1 ms
−1 ) are plotted versus frequency. Each point represents the mean threshold for each fi ber. The Type 1 response
is split into 2 responses Type 1–1 ( black circle ) responded to the entire frequency range ( n = 25)
and Type 1–2 ( triangle ) responded to a maximum frequency of 250 Hz ( n = 8). Phasic ( inverted
triangle Type 2, n = 4), inhibitory ( square , Type 3, n = 1). Modifi ed from Radford and Mensinger
( 2014 )
Multimodal Sensory Input in the Utricle and Lateral Line of the Toadfi sh, Opsanus…