

238
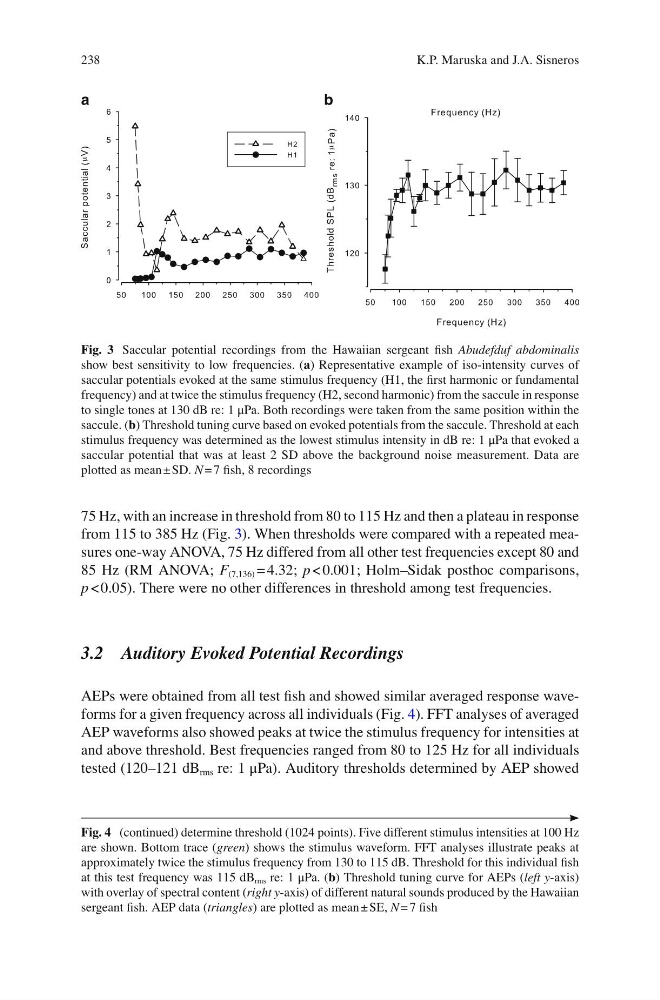
75 Hz, with an increase in threshold from 80 to 115 Hz and then a plateau in response
from 115 to 385 Hz (Fig. 3 ). When thresholds were compared with a repeated measures one-way ANOVA, 75 Hz differed from all other test frequencies except 80 and
85 Hz (RM ANOVA; F (7,136) = 4.32; p < 0.001; Holm–Sidak posthoc comparisons,
p < 0.05). There were no other differences in threshold among test frequencies.
3.2 Auditory Evoked Potential Recordings
AEPs were obtained from all test fi sh and showed similar averaged response waveforms for a given frequency across all individuals (Fig. 4 ). FFT analyses of averaged
AEP waveforms also showed peaks at twice the stimulus frequency for intensities at
and above threshold. Best frequencies ranged from 80 to 125 Hz for all individuals
tested (120–121 dB rms re: 1 μPa). Auditory thresholds determined by AEP showed
a
b
Fig. 3 Saccular potential recordings from the Hawaiian sergeant fi sh Abudefduf abdominalis
show best sensitivity to low frequencies. ( a ) Representative example of iso-intensity curves of
saccular potentials evoked at the same stimulus frequency (H1, the fi rst harmonic or fundamental
frequency) and at twice the stimulus frequency (H2, second harmonic) from the saccule in response
to single tones at 130 dB re: 1 μPa. Both recordings were taken from the same position within the
saccule. ( b ) Threshold tuning curve based on evoked potentials from the saccule. Threshold at each
stimulus frequency was determined as the lowest stimulus intensity in dB re: 1 μPa that evoked a
saccular potential that was at least 2 SD above the background noise measurement. Data are
plotted as mean ± SD. N = 7 fi sh, 8 recordings
Fig. 4 (continued) determine threshold (1024 points). Five different stimulus intensities at 100 Hz
are shown. Bottom trace ( green ) shows the stimulus waveform. FFT analyses illustrate peaks at
approximately twice the stimulus frequency from 130 to 115 dB. Threshold for this individual fi sh
at this test frequency was 115 dB rms re: 1 μPa. ( b ) Threshold tuning curve for AEPs ( left y -axis)
with overlay of spectral content ( right y -axis) of different natural sounds produced by the Hawaiian
sergeant fi sh. AEP data ( triangles ) are plotted as mean ± SE, N = 7 fi sh
K.P. Maruska and J.A. Sisneros
75 Hz, with an increase in threshold from 80 to 115 Hz and then a plateau in response
from 115 to 385 Hz (Fig. 3 ). When thresholds were compared with a repeated measures one-way ANOVA, 75 Hz differed from all other test frequencies except 80 and
85 Hz (RM ANOVA; F (7,136) = 4.32; p < 0.001; Holm–Sidak posthoc comparisons,
p < 0.05). There were no other differences in threshold among test frequencies.
3.2 Auditory Evoked Potential Recordings
AEPs were obtained from all test fi sh and showed similar averaged response waveforms for a given frequency across all individuals (Fig. 4 ). FFT analyses of averaged
AEP waveforms also showed peaks at twice the stimulus frequency for intensities at
and above threshold. Best frequencies ranged from 80 to 125 Hz for all individuals
tested (120–121 dB rms re: 1 μPa). Auditory thresholds determined by AEP showed
a
b
Fig. 3 Saccular potential recordings from the Hawaiian sergeant fi sh Abudefduf abdominalis
show best sensitivity to low frequencies. ( a ) Representative example of iso-intensity curves of
saccular potentials evoked at the same stimulus frequency (H1, the fi rst harmonic or fundamental
frequency) and at twice the stimulus frequency (H2, second harmonic) from the saccule in response
to single tones at 130 dB re: 1 μPa. Both recordings were taken from the same position within the
saccule. ( b ) Threshold tuning curve based on evoked potentials from the saccule. Threshold at each
stimulus frequency was determined as the lowest stimulus intensity in dB re: 1 μPa that evoked a
saccular potential that was at least 2 SD above the background noise measurement. Data are
plotted as mean ± SD. N = 7 fi sh, 8 recordings
Fig. 4 (continued) determine threshold (1024 points). Five different stimulus intensities at 100 Hz
are shown. Bottom trace ( green ) shows the stimulus waveform. FFT analyses illustrate peaks at
approximately twice the stimulus frequency from 130 to 115 dB. Threshold for this individual fi sh
at this test frequency was 115 dB rms re: 1 μPa. ( b ) Threshold tuning curve for AEPs ( left y -axis)
with overlay of spectral content ( right y -axis) of different natural sounds produced by the Hawaiian
sergeant fi sh. AEP data ( triangles ) are plotted as mean ± SE, N = 7 fi sh
K.P. Maruska and J.A. Sisneros