

16 Comparative Genomic Hybridization
213
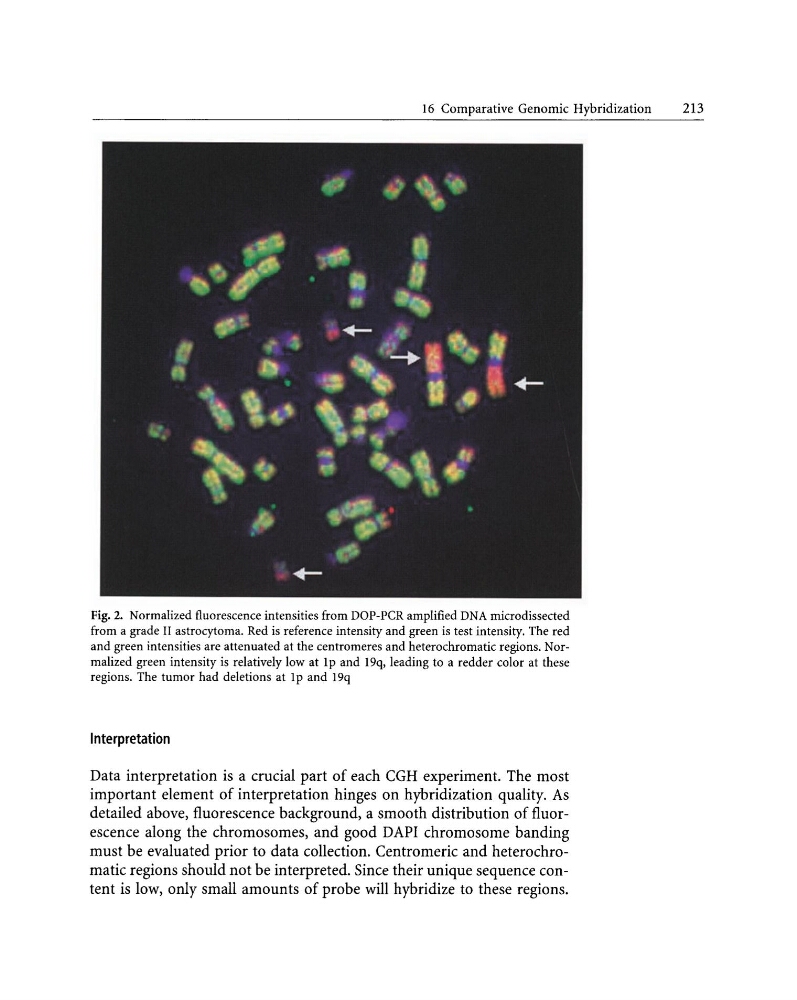
Fig. 2. Normalized fluorescence intensities from DOP-PCR amplified DNA microdissected
from a grade 11 astrocytoma. Red is reference intensity and green is test intensity. The red
and green intensities are attenuated at the centromeres and heterochromatic regions. Normalized green intensity is relatively low at Ip and 19q, leading to a redder color at these
regions. The tumor had deletions at Ip and 19q
Interpretation
Data interpretation is a crucial part of each CGH experiment. The most
important element of interpretation hinges on hybridization quality. As
detailed above, fluorescence background, a smooth distribution of fluorescence along the chromosomes, and good DAPI chromosome banding
must be evaluated prior to data collection. Centromeric and heterochromatic regions should not be interpreted. Since their unique sequence content is low, only small amounts of probe will hybridize to these regions.
213
Fig. 2. Normalized fluorescence intensities from DOP-PCR amplified DNA microdissected
from a grade 11 astrocytoma. Red is reference intensity and green is test intensity. The red
and green intensities are attenuated at the centromeres and heterochromatic regions. Normalized green intensity is relatively low at Ip and 19q, leading to a redder color at these
regions. The tumor had deletions at Ip and 19q
Interpretation
Data interpretation is a crucial part of each CGH experiment. The most
important element of interpretation hinges on hybridization quality. As
detailed above, fluorescence background, a smooth distribution of fluorescence along the chromosomes, and good DAPI chromosome banding
must be evaluated prior to data collection. Centromeric and heterochromatic regions should not be interpreted. Since their unique sequence content is low, only small amounts of probe will hybridize to these regions.