

6 Epithelial Cells from Buccal Smears and Urine
105
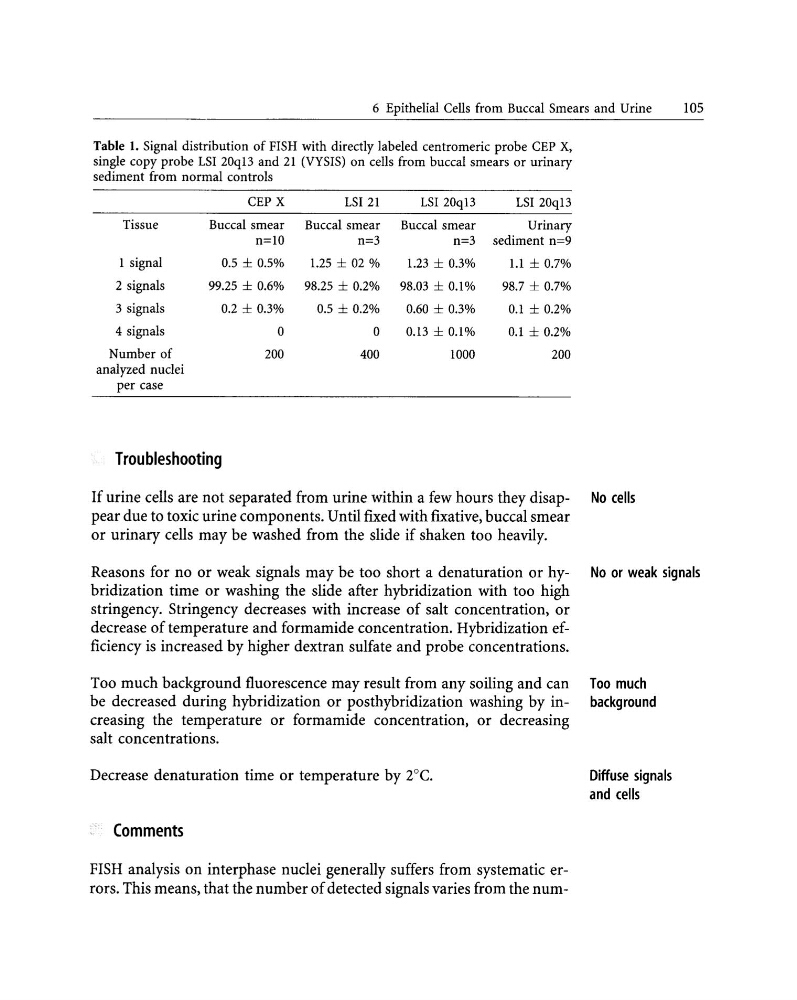
Table I. Signal distribution of FISH with directly labeled centromeric probe CEP X,
single copy probe LSI 20q13 and 21 (VYSIS) on cells from buccal smears or urinary
sediment from normal controls
CEP X
LSI 21
LSI20q13
LSI20q13
Tissue
Buccal smear
Buccal smear
Buccal smear
Urinary
n=1O
n=3
n=3 sediment n=9
I signal
0.5 ± 0.5%
1.25 ± 02 %
1.23 ± 0.3%
l.l ± 0.7%
2 signals
99.25 ± 0.6% 98.25 ± 0.2% 98.03 ± 0.1%
98.7 ± 0.7%
3 signals
0.2 ± 0.3%
0.5 ± 0.2%
0.60 ± 0.3%
0.1 ± 0.2%
4 signals
0
0
0.13 ± 0.1%
0.1 ± 0.2%
Number of
200
400
1000
200
analyzed nuclei
per case
Troubleshooting
If urine cells are not separated from urine within a few hours they disappear due to toxic urine components. Until fixed with fixative, buccal smear
or urinary cells may be washed from the slide if shaken too heavily.
Reasons for no or weak signals may be too short a denaturation or hybridization time or washing the slide after hybridization with too high
stringency. Stringency decreases with increase of salt concentration, or
decrease of temperature and formamide concentration. Hybridization efficiency is increased by higher dextran sulfate and probe concentrations.
Too much background fluorescence may result from any soiling and can
be decreased during hybridization or posthybridization washing by increasing the temperature or formamide concentration, or decreasing
salt concentrations.
Decrease denaturation time or temperature by 2°e.
Comments
FISH analysis on interphase nuclei generally suffers from systematic errors. This means, that the number of detected signals varies from the numNo cells
No or weak signals
Too much
background
Diffuse signals
and cells
105
Table I. Signal distribution of FISH with directly labeled centromeric probe CEP X,
single copy probe LSI 20q13 and 21 (VYSIS) on cells from buccal smears or urinary
sediment from normal controls
CEP X
LSI 21
LSI20q13
LSI20q13
Tissue
Buccal smear
Buccal smear
Buccal smear
Urinary
n=1O
n=3
n=3 sediment n=9
I signal
0.5 ± 0.5%
1.25 ± 02 %
1.23 ± 0.3%
l.l ± 0.7%
2 signals
99.25 ± 0.6% 98.25 ± 0.2% 98.03 ± 0.1%
98.7 ± 0.7%
3 signals
0.2 ± 0.3%
0.5 ± 0.2%
0.60 ± 0.3%
0.1 ± 0.2%
4 signals
0
0
0.13 ± 0.1%
0.1 ± 0.2%
Number of
200
400
1000
200
analyzed nuclei
per case
Troubleshooting
If urine cells are not separated from urine within a few hours they disappear due to toxic urine components. Until fixed with fixative, buccal smear
or urinary cells may be washed from the slide if shaken too heavily.
Reasons for no or weak signals may be too short a denaturation or hybridization time or washing the slide after hybridization with too high
stringency. Stringency decreases with increase of salt concentration, or
decrease of temperature and formamide concentration. Hybridization efficiency is increased by higher dextran sulfate and probe concentrations.
Too much background fluorescence may result from any soiling and can
be decreased during hybridization or posthybridization washing by increasing the temperature or formamide concentration, or decreasing
salt concentrations.
Decrease denaturation time or temperature by 2°e.
Comments
FISH analysis on interphase nuclei generally suffers from systematic errors. This means, that the number of detected signals varies from the numNo cells
No or weak signals
Too much
background
Diffuse signals
and cells