

202
R.F. Robertson et al.
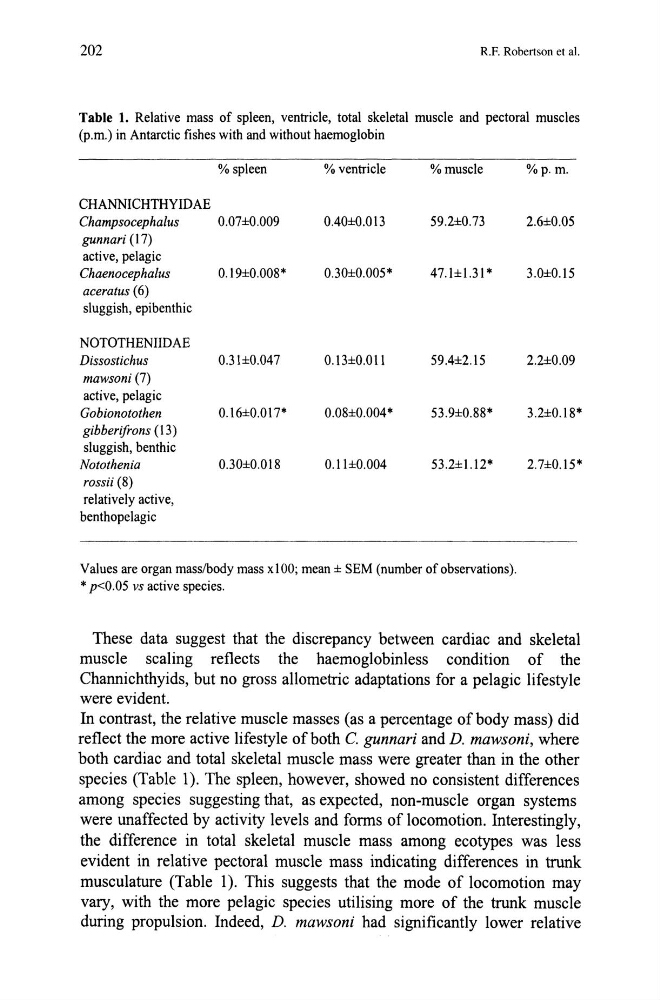
Table 1. Relative mass of spleen, ventricle, total skeletal muscle and pectoral muscles
(p.m.) in Antarctic fishes with and without haemoglobin
% spleen
% ventricle
% muscle
CHANNICHTHYIDAE
Champsocephalus
0.07±0.009
0.40±0.013
59.2±0.73
gunnari (17)
active, pelagic
Chaenocephalus
0.19±0.008*
0.30±0.005*
47.1±1.31 *
aceratus (6)
sluggish, epibenthic
NOTOTHENIIDAE
Dissostichus
0.3\±0.047
0.13±0.01l
59.4±2.15
mawsoni (7)
active, pelagic
Gobionotothen
0.16±0.0 17*
0.08±0.004*
53.9±0.88*
gibberifrons (13)
sluggish, benthic
Notothenia
0.30±0.018
0.11±0.004
53.2±1.l2*
rossii (8)
relatively active,
benthopelagic
Values are organ mass/body mass xl 00; mean ± SEM (number of observations).
* p<0.05 vs active species.
%p.m.
2.6±0.05
3.0±0.15
2.2±0.09
3.2±0.18*
2.7±0.15*
These data suggest that the discrepancy between cardiac and skeletal
muscle scaling reflects the haemoglobinless condition of the
Channichthyids, but no gross allometric adaptations for a pelagic lifestyle
were evident.
In contrast, the relative muscle masses (as a percentage of body mass) did
reflect the more active lifestyle of both C. gunnari and D. mawsoni, where
both cardiac and total skeletal muscle mass were greater than in the other
species (Table 1). The spleen, however, showed no consistent differences
among species suggesting that, as expected, non-muscle organ systems
were unaffected by activity levels and forms of locomotion. Interestingly,
the difference in total skeletal muscle mass among ecotypes was less
evident in relative pectoral muscle mass indicating differences in trunk
musculature (Table 1). This suggests that the mode of locomotion may
vary, with the more pelagic species utilising more of the trunk muscle
during propulsion. Indeed, D. mawsoni had significantly lower relative
R.F. Robertson et al.
Table 1. Relative mass of spleen, ventricle, total skeletal muscle and pectoral muscles
(p.m.) in Antarctic fishes with and without haemoglobin
% spleen
% ventricle
% muscle
CHANNICHTHYIDAE
Champsocephalus
0.07±0.009
0.40±0.013
59.2±0.73
gunnari (17)
active, pelagic
Chaenocephalus
0.19±0.008*
0.30±0.005*
47.1±1.31 *
aceratus (6)
sluggish, epibenthic
NOTOTHENIIDAE
Dissostichus
0.3\±0.047
0.13±0.01l
59.4±2.15
mawsoni (7)
active, pelagic
Gobionotothen
0.16±0.0 17*
0.08±0.004*
53.9±0.88*
gibberifrons (13)
sluggish, benthic
Notothenia
0.30±0.018
0.11±0.004
53.2±1.l2*
rossii (8)
relatively active,
benthopelagic
Values are organ mass/body mass xl 00; mean ± SEM (number of observations).
* p<0.05 vs active species.
%p.m.
2.6±0.05
3.0±0.15
2.2±0.09
3.2±0.18*
2.7±0.15*
These data suggest that the discrepancy between cardiac and skeletal
muscle scaling reflects the haemoglobinless condition of the
Channichthyids, but no gross allometric adaptations for a pelagic lifestyle
were evident.
In contrast, the relative muscle masses (as a percentage of body mass) did
reflect the more active lifestyle of both C. gunnari and D. mawsoni, where
both cardiac and total skeletal muscle mass were greater than in the other
species (Table 1). The spleen, however, showed no consistent differences
among species suggesting that, as expected, non-muscle organ systems
were unaffected by activity levels and forms of locomotion. Interestingly,
the difference in total skeletal muscle mass among ecotypes was less
evident in relative pectoral muscle mass indicating differences in trunk
musculature (Table 1). This suggests that the mode of locomotion may
vary, with the more pelagic species utilising more of the trunk muscle
during propulsion. Indeed, D. mawsoni had significantly lower relative