

156
A
',lI(I
.,..,~:;:~-J------:,=,----::-!~.,., -IN -t,. -to 0 40 _JO ~II(I
,..
V. Carginale et al.
B
•• jj)
-·fI!l~"=';''''~''''!----'.!-''':'::--:-.!:' "':-::!IIIIi'IM
...
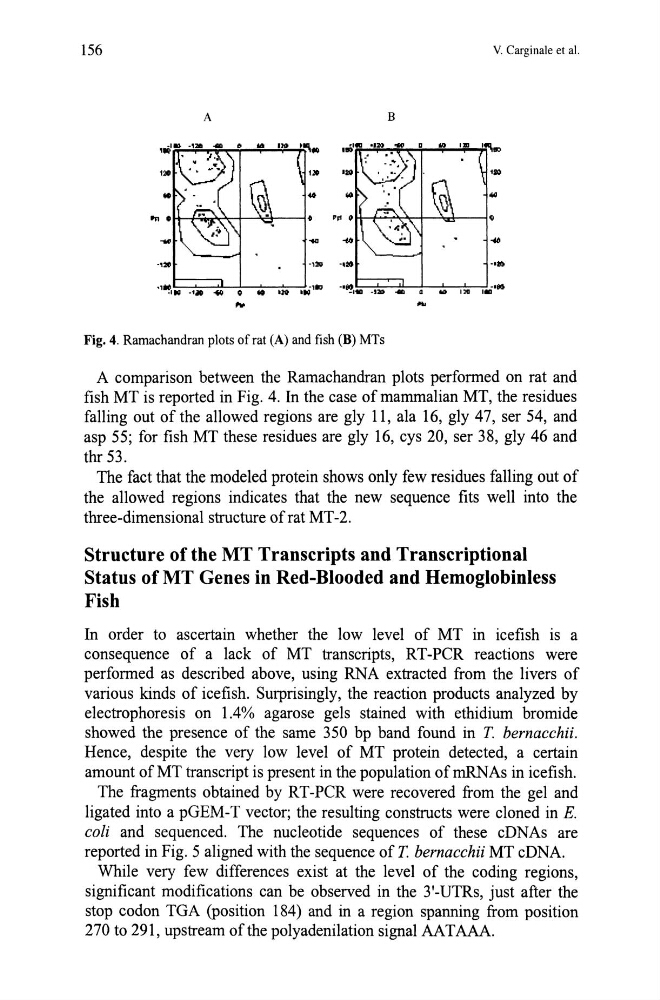
Fig. 4. Ramachandran plots of rat (A) and fish (B) MTs
A comparison between the Ramachandran plots performed on rat and
fish MT is reported in Fig. 4. In the case of mammalian MT, the residues
falling out of the allowed regions are gly 11, ala 16, gly 47, ser 54, and
asp 55; for fish MT these residues are gly 16, cys 20, ser 38, gly 46 and
thr 53.
The fact that the modeled protein shows only few residues falling out of
the allowed regions indicates that the new sequence fits well into the
three-dimensional structure of rat MT-2.
Structure of the MT Transcripts and Transcriptional
Status of MT Genes in Red-Blooded and Hemoglobinless
Fish
In order to ascertain whether the low level of MT in icefish is a
consequence of a lack of MT transcripts, RT-PCR reactions were
performed as described above, using RNA extracted from the livers of
various kinds of icefish. Surprisingly, the reaction products analyzed by
electrophoresis on 1.4% agarose gels stained with ethidium bromide
showed the presence of the same 350 bp band found in T. bernacchii.
Hence, despite the very low level of MT protein detected, a certain
amount of MT transcript is present in the population of mRNAs in icefish.
The fragments obtained by RT-PCR were recovered from the gel and
ligated into a pGEM-T vector; the resulting constructs were cloned in E.
coli and sequenced. The nucleotide sequences of these cDNAs are
reported in Fig. 5 aligned with the sequence of T bernacchii MT cDNA.
While very few differences exist at the level of the coding regions,
significant modifications can be observed in the 3'-VTRs, just after the
stop codon TGA (position 184) and in a region spanning from position
270 to 291, upstream of the polyadenilation signal AATAAA.
A
',lI(I
.,..,~:;:~-J------:,=,----::-!~.,., -IN -t,. -to 0 40 _JO ~II(I
,..
V. Carginale et al.
B
•• jj)
-·fI!l~"=';''''~''''!----'.!-''':'::--:-.!:' "':-::!IIIIi'IM
...
Fig. 4. Ramachandran plots of rat (A) and fish (B) MTs
A comparison between the Ramachandran plots performed on rat and
fish MT is reported in Fig. 4. In the case of mammalian MT, the residues
falling out of the allowed regions are gly 11, ala 16, gly 47, ser 54, and
asp 55; for fish MT these residues are gly 16, cys 20, ser 38, gly 46 and
thr 53.
The fact that the modeled protein shows only few residues falling out of
the allowed regions indicates that the new sequence fits well into the
three-dimensional structure of rat MT-2.
Structure of the MT Transcripts and Transcriptional
Status of MT Genes in Red-Blooded and Hemoglobinless
Fish
In order to ascertain whether the low level of MT in icefish is a
consequence of a lack of MT transcripts, RT-PCR reactions were
performed as described above, using RNA extracted from the livers of
various kinds of icefish. Surprisingly, the reaction products analyzed by
electrophoresis on 1.4% agarose gels stained with ethidium bromide
showed the presence of the same 350 bp band found in T. bernacchii.
Hence, despite the very low level of MT protein detected, a certain
amount of MT transcript is present in the population of mRNAs in icefish.
The fragments obtained by RT-PCR were recovered from the gel and
ligated into a pGEM-T vector; the resulting constructs were cloned in E.
coli and sequenced. The nucleotide sequences of these cDNAs are
reported in Fig. 5 aligned with the sequence of T bernacchii MT cDNA.
While very few differences exist at the level of the coding regions,
significant modifications can be observed in the 3'-VTRs, just after the
stop codon TGA (position 184) and in a region spanning from position
270 to 291, upstream of the polyadenilation signal AATAAA.