

Metallothionein in Antarctic Fish
Table 1. MT content in Antarctic fish livers. MT content was determined by silver
saturation assay. Quantification ofMT was performed on the basis of standard curves
obtained with rabbit MT in the silver assay
5
C. hamatus
C. rastrospinosus
C. aceratus
T bernacchii
A
0.4
4
Ilg MT/ mg protein
Silver assay
0.2 ± 0.01
0.004 ± 0.002
0.0025 ± 0.002
1.3 ± 0.2
B
2
153
4
0.3,
3
1. 5 1
~3
- ~2
!
0.2~
1
••
I 2
I
N
-
"S"
1
0.1.!.
1
0.5_
0
0
0
0
0
40
80
120
0
40
80
120
Fraction no.
Fraction no.
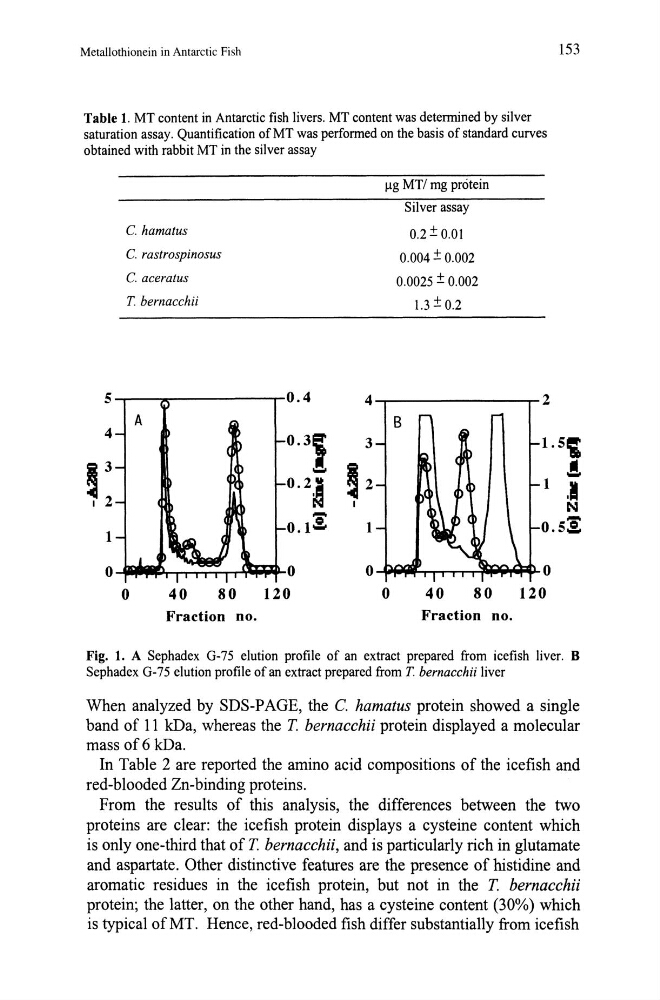
Fig. 1. A Sephadex G-75 elution profile of an extract prepared from icefish liver. B
Sephadex G-75 elution profile of an extract prepared from T bernacchii liver
When analyzed by SDS-PAGE, the C. hamatus protein showed a single
band of 11 kDa, whereas the T. bernacchii protein displayed a molecular
mass of 6 kDa.
In Table 2 are reported the amino acid compositions of the icefish and
red-blooded Zn-binding proteins.
From the results of this analysis, the differences between the two
proteins are clear: the icefish protein displays a cysteine content which
is only one-third that of T. bernacchii, and is particularly rich in glutamate
and aspartate. Other distinctive features are the presence of histidine and
aromatic residues in the icefish protein, but not in the T. bernacchii
protein; the latter, on the other hand, has a cysteine content (30%) which
is typical ofMT. Hence, red-blooded fish differ substantially from icefish
Table 1. MT content in Antarctic fish livers. MT content was determined by silver
saturation assay. Quantification ofMT was performed on the basis of standard curves
obtained with rabbit MT in the silver assay
5
C. hamatus
C. rastrospinosus
C. aceratus
T bernacchii
A
0.4
4
Ilg MT/ mg protein
Silver assay
0.2 ± 0.01
0.004 ± 0.002
0.0025 ± 0.002
1.3 ± 0.2
B
2
153
4
0.3,
3
1. 5 1
~3
- ~2
!
0.2~
1
••
I 2
I
N
-
"S"
1
0.1.!.
1
0.5_
0
0
0
0
0
40
80
120
0
40
80
120
Fraction no.
Fraction no.
Fig. 1. A Sephadex G-75 elution profile of an extract prepared from icefish liver. B
Sephadex G-75 elution profile of an extract prepared from T bernacchii liver
When analyzed by SDS-PAGE, the C. hamatus protein showed a single
band of 11 kDa, whereas the T. bernacchii protein displayed a molecular
mass of 6 kDa.
In Table 2 are reported the amino acid compositions of the icefish and
red-blooded Zn-binding proteins.
From the results of this analysis, the differences between the two
proteins are clear: the icefish protein displays a cysteine content which
is only one-third that of T. bernacchii, and is particularly rich in glutamate
and aspartate. Other distinctive features are the presence of histidine and
aromatic residues in the icefish protein, but not in the T. bernacchii
protein; the latter, on the other hand, has a cysteine content (30%) which
is typical ofMT. Hence, red-blooded fish differ substantially from icefish