

176
30.-------------------------~
25
Days of incubation
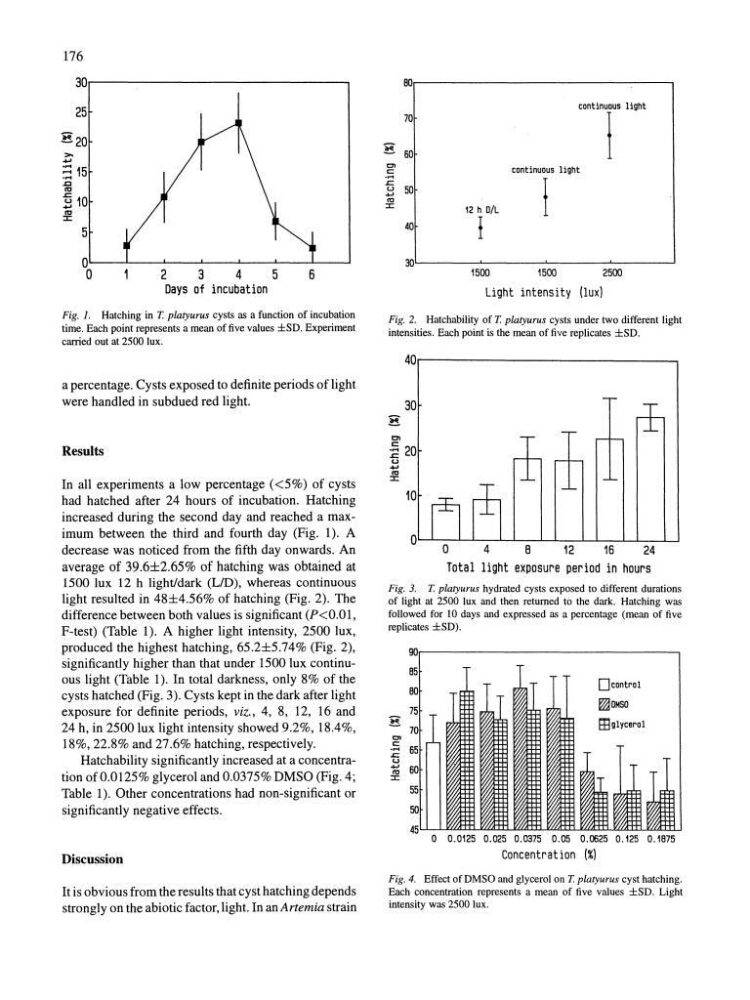
Fig. 1. Hatching in T. platyurus cysts as a function of incubation
time. Each point represents a mean of five values ±SD. Experiment
carried out at 2500 lux.
a percentage. Cysts exposed to definite periods of light
BO
continuous light
70
1
E 60
CI
continuous light
c:
....
I
~
<.J
50
.....
ttl
:I:
12 h OIL
40
I
30
1500
1500
2500
Light intensity (lux)
Fig. 2. Hatchability of T. platyurus cysts under two different light
intensities. Each point is the mean of five replicates ±SD.
40r-------------------------~
were handled in subdued red light.
30
Results
In all experiments a low percentage «5%) of cysts
had hatched after 24 hours of incubation. Hatching
increased during the second day and reached a maximum between the third and fourth day (Fig. 1). A
decrease was noticed from the fifth day onwards. An
average of 39.6±2.65% of hatching was obtained at
1500 lux 12 h light/dark (LID), whereas continuous
light resulted in 48±4.56% of hatching (Fig. 2). The
difference between both values is significant (P
produced the highest hatching, 65.2±5.74% (Fig. 2),
significantly higher than that under 1500 lux continuous light (Table 1). In total darkness, only 8% of the
cysts hatched (Fig. 3). Cysts kept in the dark after light
exposure for definite periods, viz., 4, 8, 12, 16 and
24 h, in 2500 lux light intensity showed 9.2%, 18.4%,
18%,22.8% and 27.6% hatching, respectively.
Hatchability significantly increased at a concentration of 0.0125% glycerol and 0.0375% DMSO (Fig. 4;
Table 1). Other concentrations had non-significant or
significantly negative effects.
Discussion
It is obvious from the results that cyst hatching depends
strongly on the abiotic factor, light. In an Artemia strain
E
CI
~ 20
~
<.J
.....
~
Total light exposure period in hours
Fig. 3. T. platyurus hydrated cysts exposed to different durations
of light at 2500 lux and then returned to the dark. Hatching was
followed for 10 days and expressed as a percentage (mean of five
replicates ±SD).
nn
~.
85
eo
75
E 70
CI
c: 65
....
~
..,
60
..... ttl
:I:
55
50
~
0 0.0125
Dcontrol
~OM50
(Eglycerol
0.025 0.0375 0.05 0.0625 0.125 0.1675
Concentrat ion (%)
Fig. 4. Effect of DMSO and glycerol on T. platyurus cyst hatching.
Each concentration represents a mean of five values ±SD. Light
intensity was 2500 lux.
30.-------------------------~
25
Days of incubation
Fig. 1. Hatching in T. platyurus cysts as a function of incubation
time. Each point represents a mean of five values ±SD. Experiment
carried out at 2500 lux.
a percentage. Cysts exposed to definite periods of light
BO
continuous light
70
1
E 60
CI
continuous light
c:
....
I
~
<.J
50
.....
ttl
:I:
12 h OIL
40
I
30
1500
1500
2500
Light intensity (lux)
Fig. 2. Hatchability of T. platyurus cysts under two different light
intensities. Each point is the mean of five replicates ±SD.
40r-------------------------~
were handled in subdued red light.
30
Results
In all experiments a low percentage «5%) of cysts
had hatched after 24 hours of incubation. Hatching
increased during the second day and reached a maximum between the third and fourth day (Fig. 1). A
decrease was noticed from the fifth day onwards. An
average of 39.6±2.65% of hatching was obtained at
1500 lux 12 h light/dark (LID), whereas continuous
light resulted in 48±4.56% of hatching (Fig. 2). The
difference between both values is significant (P
produced the highest hatching, 65.2±5.74% (Fig. 2),
significantly higher than that under 1500 lux continuous light (Table 1). In total darkness, only 8% of the
cysts hatched (Fig. 3). Cysts kept in the dark after light
exposure for definite periods, viz., 4, 8, 12, 16 and
24 h, in 2500 lux light intensity showed 9.2%, 18.4%,
18%,22.8% and 27.6% hatching, respectively.
Hatchability significantly increased at a concentration of 0.0125% glycerol and 0.0375% DMSO (Fig. 4;
Table 1). Other concentrations had non-significant or
significantly negative effects.
Discussion
It is obvious from the results that cyst hatching depends
strongly on the abiotic factor, light. In an Artemia strain
E
CI
~ 20
~
<.J
.....
~
Total light exposure period in hours
Fig. 3. T. platyurus hydrated cysts exposed to different durations
of light at 2500 lux and then returned to the dark. Hatching was
followed for 10 days and expressed as a percentage (mean of five
replicates ±SD).
nn
~.
85
eo
75
E 70
CI
c: 65
....
~
..,
60
..... ttl
:I:
55
50
~
0 0.0125
Dcontrol
~OM50
(Eglycerol
0.025 0.0375 0.05 0.0625 0.125 0.1675
Concentrat ion (%)
Fig. 4. Effect of DMSO and glycerol on T. platyurus cyst hatching.
Each concentration represents a mean of five values ±SD. Light
intensity was 2500 lux.