

20
lB
16
14
12
E 10
..s
m
B
.!!!
II)
6
4
" 25 ° C
D
30 ° C
0
35 ° C
5
10
15
2025
30
Age (days)
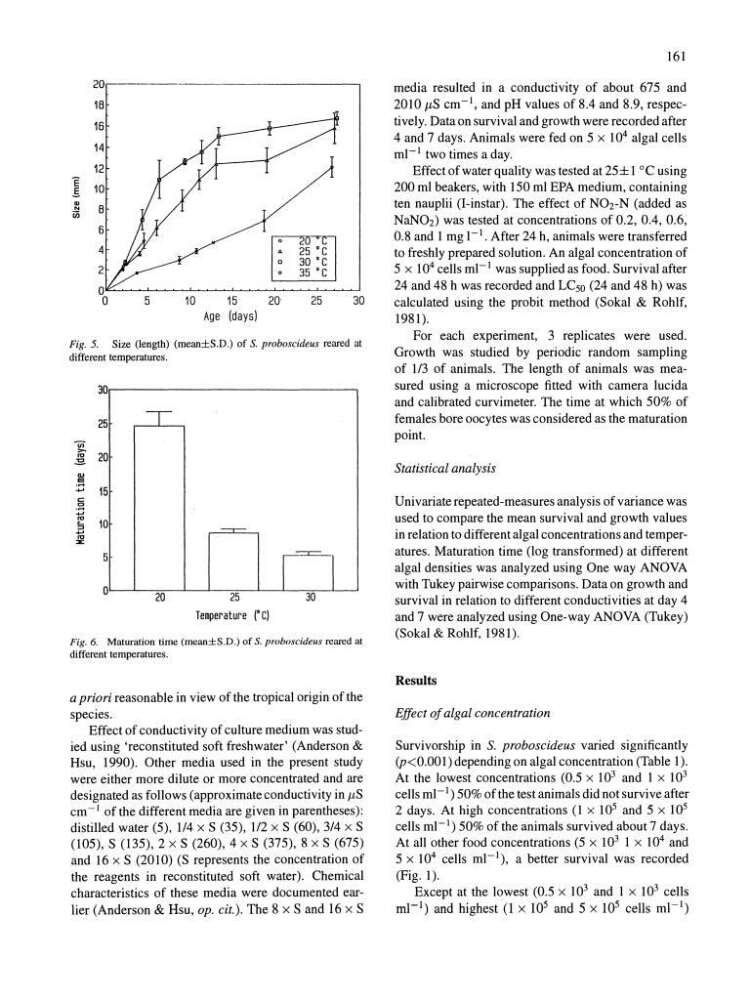
Fig. 5. Size (length) (mean±S.D.) of S. proboscideus reared at
different temperatures.
30
25
Ui"
>20
10
.:s
aJ
e
.~
..... 15
c:
.::l
..... 10 10
<::>
..... 10
::E
5
0
I
20
~
25
Temperature (0 C)
r-I
30
Fig. 6. Maturation time (mean±S.D.) of S. proboscideus reared at
different temperatures.
a priori reasonable in view of the tropical origin of the
species.
Effect of conductivity of culture medium was studied using 'reconstituted soft freshwater' (Anderson &
Hsu, 1990). Other media used in the present study
were either more dilute or more concentrated and are
designated as follows (approximate conductivity in p,S
cm- I of the different media are given in parentheses);
distilled water (5), 114 x S (35), 112 x S (60), 3/4 x S
(105), S (135), 2 x S (260), 4 x S (375), 8 x S (675)
and 16 x S (2010) (S represents the concentration of
the reagents in reconstituted soft water). Chemical
characteristics of these media were documented earlier (Anderson & Hsu, op. cit.). The 8 x Sand 16 x S
161
media resulted in a conductivity of about 675 and
2010 p,S cm- I , and pH values of 8.4 and 8.9, respectively. Data on survival and growth were recorded after
4 and 7 days. Animals were fed on 5 x 10 4 algal cells
ml- I two times a day.
Effect of water quality was tested at 25± 1 °C using
200 ml beakers, with 150 ml EPA medium, containing
ten nauplii (I-instar). The effect of N02-N (added as
NaN02) was tested at concentrations of 0.2, 0.4, 0.6,
0.8 and 1 mg I-I. After 24 h, animals were transferred
to freshly prepared solution. An algal concentration of
5 x 10 4 cells ml- I was supplied as food. Survival after
24 and 48 h was recorded and LC50 (24 and 48 h) was
calculated using the pro bit method (Sokal & Rohlf,
1981).
For each experiment, 3 replicates were used.
Growth was studied by periodic random sampling
of 113 of animals. The length of animals was measured using a microscope fitted with camera lucid a
and calibrated curvimeter. The time at which 50% of
females bore oocytes was considered as the maturation
point.
Statistical analysis
Univariate repeated-measures analysis of variance was
used to compare the mean survival and growth values
in relation to different algal concentrations and temperatures. Maturation time (log transformed) at different
algal densities was analyzed using One way ANOVA
with Tukey pairwise comparisons. Data on growth and
survival in relation to different conductivities at day 4
and 7 were analyzed using One-way ANOVA (Tukey)
(Sokal & Rohlf, 1981).
Results
Effect of algal concentration
Survivorship in S. proboscideus varied significantly
(p<0.001) depending on algal concentration (Table 1).
At the lowest concentrations (0.5 x 10 3 and 1 x 10 3
cells ml- I ) 50% of the test animals did not survive after
2 days. At high concentrations (1 x 10 5 and 5 x 10 5
cells ml- I ) 50% of the animals survived about 7 days.
At all other food concentrations (5 x 10 3 1 X 10 4 and
5 x 10 4 cells ml- I ), a better survival was recorded
(Fig. 1).
Except at the lowest (0.5 x 10 3 and 1 x 10 3 cells
ml- 1 ) and highest (1 x 10 5 and 5 x 10 5 cells ml- I )
lB
16
14
12
E 10
..s
m
B
.!!!
II)
6
4
" 25 ° C
D
30 ° C
0
35 ° C
5
10
15
2025
30
Age (days)
Fig. 5. Size (length) (mean±S.D.) of S. proboscideus reared at
different temperatures.
30
25
Ui"
>20
10
.:s
aJ
e
.~
..... 15
c:
.::l
..... 10 10
<::>
..... 10
::E
5
0
I
20
~
25
Temperature (0 C)
r-I
30
Fig. 6. Maturation time (mean±S.D.) of S. proboscideus reared at
different temperatures.
a priori reasonable in view of the tropical origin of the
species.
Effect of conductivity of culture medium was studied using 'reconstituted soft freshwater' (Anderson &
Hsu, 1990). Other media used in the present study
were either more dilute or more concentrated and are
designated as follows (approximate conductivity in p,S
cm- I of the different media are given in parentheses);
distilled water (5), 114 x S (35), 112 x S (60), 3/4 x S
(105), S (135), 2 x S (260), 4 x S (375), 8 x S (675)
and 16 x S (2010) (S represents the concentration of
the reagents in reconstituted soft water). Chemical
characteristics of these media were documented earlier (Anderson & Hsu, op. cit.). The 8 x Sand 16 x S
161
media resulted in a conductivity of about 675 and
2010 p,S cm- I , and pH values of 8.4 and 8.9, respectively. Data on survival and growth were recorded after
4 and 7 days. Animals were fed on 5 x 10 4 algal cells
ml- I two times a day.
Effect of water quality was tested at 25± 1 °C using
200 ml beakers, with 150 ml EPA medium, containing
ten nauplii (I-instar). The effect of N02-N (added as
NaN02) was tested at concentrations of 0.2, 0.4, 0.6,
0.8 and 1 mg I-I. After 24 h, animals were transferred
to freshly prepared solution. An algal concentration of
5 x 10 4 cells ml- I was supplied as food. Survival after
24 and 48 h was recorded and LC50 (24 and 48 h) was
calculated using the pro bit method (Sokal & Rohlf,
1981).
For each experiment, 3 replicates were used.
Growth was studied by periodic random sampling
of 113 of animals. The length of animals was measured using a microscope fitted with camera lucid a
and calibrated curvimeter. The time at which 50% of
females bore oocytes was considered as the maturation
point.
Statistical analysis
Univariate repeated-measures analysis of variance was
used to compare the mean survival and growth values
in relation to different algal concentrations and temperatures. Maturation time (log transformed) at different
algal densities was analyzed using One way ANOVA
with Tukey pairwise comparisons. Data on growth and
survival in relation to different conductivities at day 4
and 7 were analyzed using One-way ANOVA (Tukey)
(Sokal & Rohlf, 1981).
Results
Effect of algal concentration
Survivorship in S. proboscideus varied significantly
(p<0.001) depending on algal concentration (Table 1).
At the lowest concentrations (0.5 x 10 3 and 1 x 10 3
cells ml- I ) 50% of the test animals did not survive after
2 days. At high concentrations (1 x 10 5 and 5 x 10 5
cells ml- I ) 50% of the animals survived about 7 days.
At all other food concentrations (5 x 10 3 1 X 10 4 and
5 x 10 4 cells ml- I ), a better survival was recorded
(Fig. 1).
Except at the lowest (0.5 x 10 3 and 1 x 10 3 cells
ml- 1 ) and highest (1 x 10 5 and 5 x 10 5 cells ml- I )