

0 >40"0
f2g 30- 40%
15J 2O- 30%
0< 20' 0
97
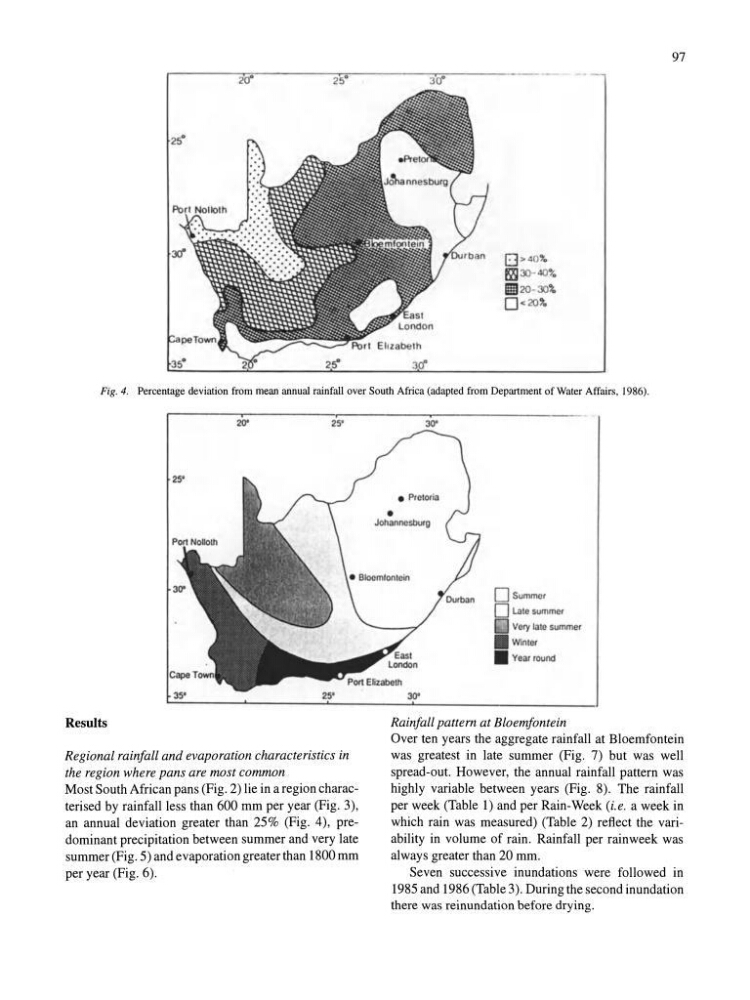
Fig. 4. Percentage deviation from mean annual rainfall over South Africa (adapted from Department of Water Affairs, 1986).
,
20'
25'
25'
35'
Results
Regional rainfall and evaporation characteristics in
the region where pans are most common
Most South African pans (Fig. 2) lie in a region characterised by rainfall less than 600 mm per year (Fig. 3),
an annual deviation greater than 25% (Fig. 4), predominant precipitation between summer and very late
summer (Fig. 5) and evaporation greater than 1800 mm
per year (Fig. 6).
.
30"
•
Johannesburg
Dsummel
D Lale summer
D Very IaIO summel
•
Win leI
•
Year round
Rainfall pattern at Bloemfontein
Over ten years the aggregate rainfall at Bloemfontein
was greatest in late summer (Fig. 7) but was well
spread-out. However, the annual rainfall pattern was
highly variable between years (Fig. 8). The rainfall
per week (Table 1) and per Rain-Week (i.e. a week in
which rain was measured) (Table 2) reflect the variability in volume of rain. Rainfall per rain week was
always greater than 20 mm.
Seven successive inundations were followed in
1985 and 1986 (Table 3). During the second inundation
there was reinundation before drying .
f2g 30- 40%
15J 2O- 30%
0< 20' 0
97
Fig. 4. Percentage deviation from mean annual rainfall over South Africa (adapted from Department of Water Affairs, 1986).
,
20'
25'
25'
35'
Results
Regional rainfall and evaporation characteristics in
the region where pans are most common
Most South African pans (Fig. 2) lie in a region characterised by rainfall less than 600 mm per year (Fig. 3),
an annual deviation greater than 25% (Fig. 4), predominant precipitation between summer and very late
summer (Fig. 5) and evaporation greater than 1800 mm
per year (Fig. 6).
.
30"
•
Johannesburg
Dsummel
D Lale summer
D Very IaIO summel
•
Win leI
•
Year round
Rainfall pattern at Bloemfontein
Over ten years the aggregate rainfall at Bloemfontein
was greatest in late summer (Fig. 7) but was well
spread-out. However, the annual rainfall pattern was
highly variable between years (Fig. 8). The rainfall
per week (Table 1) and per Rain-Week (i.e. a week in
which rain was measured) (Table 2) reflect the variability in volume of rain. Rainfall per rain week was
always greater than 20 mm.
Seven successive inundations were followed in
1985 and 1986 (Table 3). During the second inundation
there was reinundation before drying .