

Numerical Responses of Microarthropods
J.O
7 2.5
o
~2.0
~
I; 1.5
~ ::>
"'01.0
:~
~o.~
oX
0.0 +--CN~O~J~F~W~'~W~J~J~''''''';S~OC-N''--'O
T1~E (months)
~
7
o
1.5
~1.0
H . _ a
0.0 +-~~~...,-~~~~~~~~~~
N D J F W A W J J A S O N D
T1~E (month.)
0.5
~
I D ••
o
27 0.3
~
R
ga.2
"
. "
]0.1
oX
N D J F W ... M J J A S O N D
TI~E (month.)
L pukhenimul
N D J F U A U J J A S " O N O
T1~E (month.)
2.0
7
01.5
2~
~ 1.0
"0
::>
"
~O.5
.5O
oX
81
0.0 .\-~~~~~~~~~~~~~
~
7
o
O.J
.E.o.2
E
~
"0
~O.1
]
oX
N O J F W A I I o t J J A S O N D
TI~E ( months)
E.cf.hO~
0.0 +--~N~O~J~F~W~'~W~J~J~'~S~O~N- 0
1.0
'7 0.8
o
~
., 0.6
E
ui
go .•
"
." :0 .
. 5 0.2
oX
T1~E (months)
T . ..-Iatua
0.0 .\-~~~~~~~~~~~~~~
N D J F " A W J J A S O N D
T1~E (months)
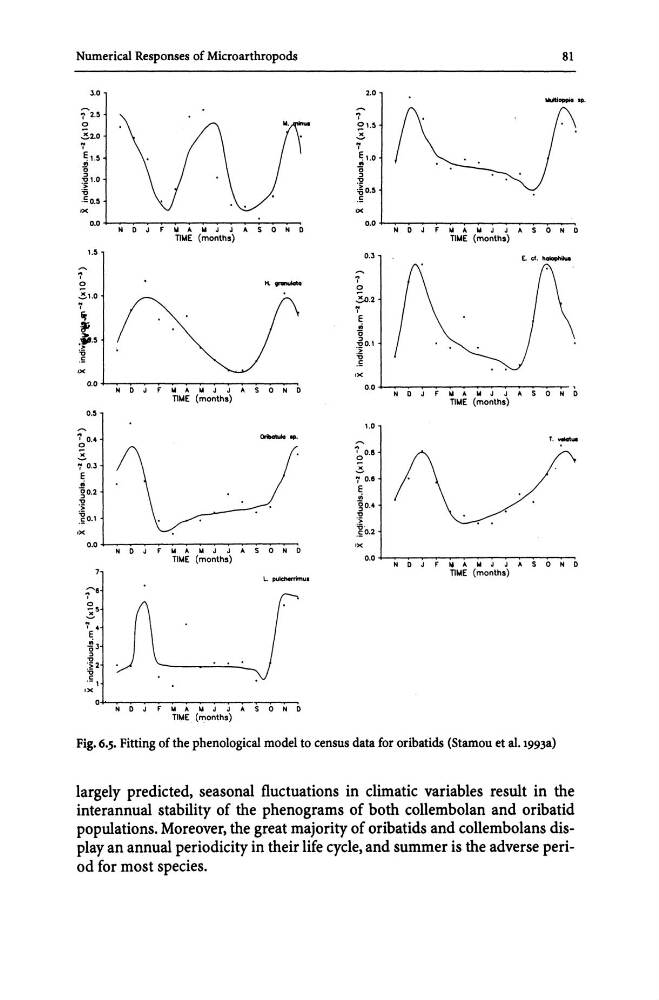
Fig. 6.5. Fitting of the phenological model to census data for oribatids (Stamou et al. 1993a)
largely predicted, seasonal fluctuations in climatic variables result in the
interannual stability of the phenograms of both collembolan and oribatid
populations. Moreover, the great majority of oribatids and collembolans display an annual periodicity in their life cycle, and summer is the adverse period for most species.
J.O
7 2.5
o
~2.0
~
I; 1.5
~ ::>
"'01.0
:~
~o.~
oX
0.0 +--CN~O~J~F~W~'~W~J~J~''''''';S~OC-N''--'O
T1~E (months)
~
7
o
1.5
~1.0
H . _ a
0.0 +-~~~...,-~~~~~~~~~~
N D J F W A W J J A S O N D
T1~E (month.)
0.5
~
I D ••
o
27 0.3
~
R
ga.2
"
. "
]0.1
oX
N D J F W ... M J J A S O N D
TI~E (month.)
L pukhenimul
N D J F U A U J J A S " O N O
T1~E (month.)
2.0
7
01.5
2~
~ 1.0
"0
::>
"
~O.5
.5O
oX
81
0.0 .\-~~~~~~~~~~~~~
~
7
o
O.J
.E.o.2
E
~
"0
~O.1
]
oX
N O J F W A I I o t J J A S O N D
TI~E ( months)
E.cf.hO~
0.0 +--~N~O~J~F~W~'~W~J~J~'~S~O~N- 0
1.0
'7 0.8
o
~
., 0.6
E
ui
go .•
"
." :0 .
. 5 0.2
oX
T1~E (months)
T . ..-Iatua
0.0 .\-~~~~~~~~~~~~~~
N D J F " A W J J A S O N D
T1~E (months)
Fig. 6.5. Fitting of the phenological model to census data for oribatids (Stamou et al. 1993a)
largely predicted, seasonal fluctuations in climatic variables result in the
interannual stability of the phenograms of both collembolan and oribatid
populations. Moreover, the great majority of oribatids and collembolans display an annual periodicity in their life cycle, and summer is the adverse period for most species.