

30
5.0
4.5
?
4.0
~
0 .... 3.5
.:
'"
3.0
:::e
..
...l 2.5
2.0
1.5
1.15
~1 .•
]1.2
~
01.0
~ 0.8
o
,30.6
~O ••
.2'0.2
0,5
1.5
2.5
3.5
LnM (mg)
4.5
5.5
25·C
20·C
30·C
15·C
10·C
5·C
0.00.0
0.2
D.. 0.6 0.8 1.0 1.2 I .•
log W u.g)
Respiratory Metabolism
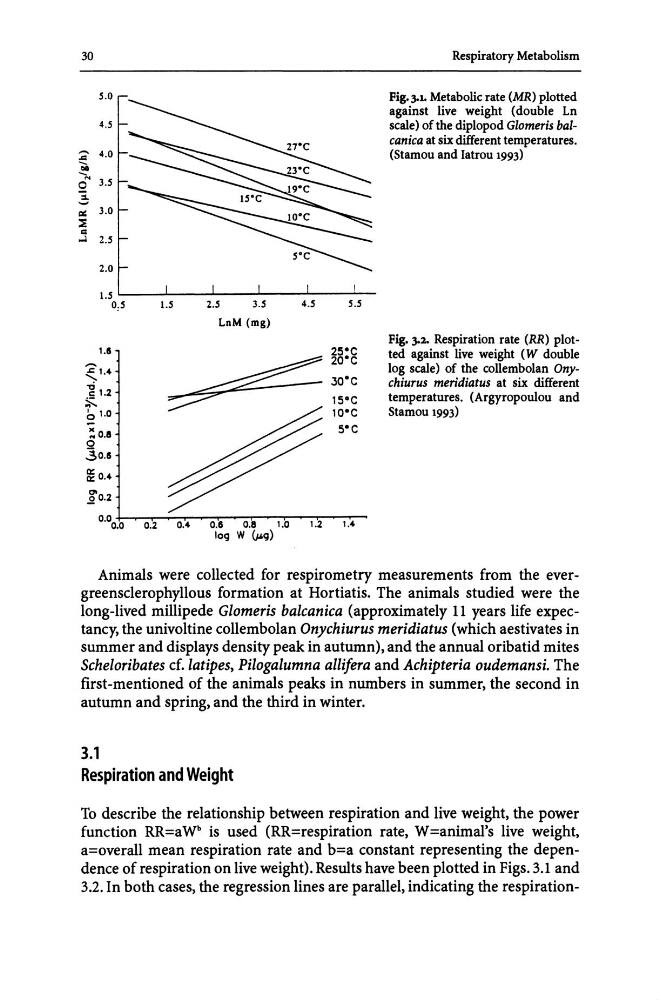
Fig. 301. Metabolic rate (MR) plotted
against live weight (double Ln
scale) of the diplopod Glomeris balcanica at six different temperatures.
(Stamou and Iatrou 1993)
Fig. 302. Respiration rate (RR) plotted against live weight (W double
log scale) of the collembolan Onychiurus meridiatus at six different
temperatures. (Argyropoulou and
Stamou 1993)
Animals were collected for respirometry measurements from the evergreensclerophyllous formation at Hortiatis. The animals studied were the
long-lived millipede Glomeris balcanica (approximately 11 years life expectancy, the univoltine collembolan Onychiurus meridiatus (which aestivates in
summer and displays density peak in autumn), and the annual oribatid mites
Scheloribates cf. latipes, Pilogalumna alli/era and Achipteria oudemansi. The
first-mentioned of the animals peaks in numbers in summer, the second in
autumn and spring, and the third in winter.
3.1
Respiration and Weight
To describe the relationship between respiration and live weight, the power
function RR=aW b is used (RR=respiration rate, W=animal's live weight,
a=overall mean respiration rate and b=a constant representing the dependence of respiration on live weight). Results have been plotted in Figs. 3.1 and
3.2. In both cases, the regression lines are parallel, indicating the respiration-
5.0
4.5
?
4.0
~
0 .... 3.5
.:
'"
3.0
:::e
..
...l 2.5
2.0
1.5
1.15
~1 .•
]1.2
~
01.0
~ 0.8
o
,30.6
~O ••
.2'0.2
0,5
1.5
2.5
3.5
LnM (mg)
4.5
5.5
25·C
20·C
30·C
15·C
10·C
5·C
0.00.0
0.2
D.. 0.6 0.8 1.0 1.2 I .•
log W u.g)
Respiratory Metabolism
Fig. 301. Metabolic rate (MR) plotted
against live weight (double Ln
scale) of the diplopod Glomeris balcanica at six different temperatures.
(Stamou and Iatrou 1993)
Fig. 302. Respiration rate (RR) plotted against live weight (W double
log scale) of the collembolan Onychiurus meridiatus at six different
temperatures. (Argyropoulou and
Stamou 1993)
Animals were collected for respirometry measurements from the evergreensclerophyllous formation at Hortiatis. The animals studied were the
long-lived millipede Glomeris balcanica (approximately 11 years life expectancy, the univoltine collembolan Onychiurus meridiatus (which aestivates in
summer and displays density peak in autumn), and the annual oribatid mites
Scheloribates cf. latipes, Pilogalumna alli/era and Achipteria oudemansi. The
first-mentioned of the animals peaks in numbers in summer, the second in
autumn and spring, and the third in winter.
3.1
Respiration and Weight
To describe the relationship between respiration and live weight, the power
function RR=aW b is used (RR=respiration rate, W=animal's live weight,
a=overall mean respiration rate and b=a constant representing the dependence of respiration on live weight). Results have been plotted in Figs. 3.1 and
3.2. In both cases, the regression lines are parallel, indicating the respiration-