

12
0>
c:
.~
(I)
~
,....-_...L_....., low frequency fires
L-.-....,..----Ilow grazing
High frequency fires
L...-_....,.._----' Moderate grazing
r--~-~low frequency fires
L------fOvergrazing
Introduction
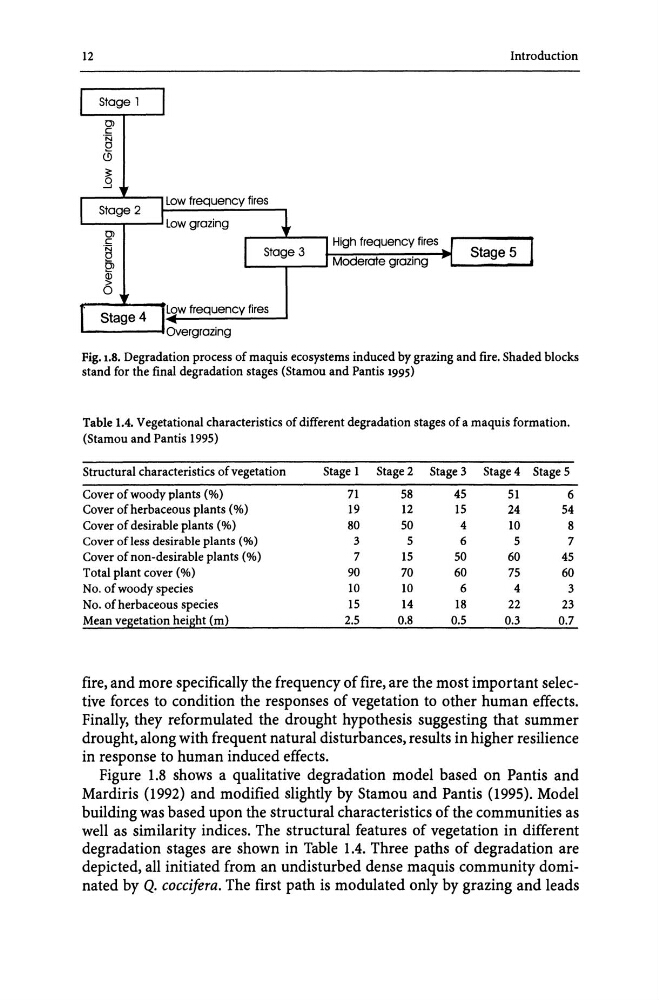
Fig. 1.8. Degradation process of maquis ecosystems induced by grazing and fire. Shaded blocks
stand for the final degradation stages (Stamou and Pantis 1995)
Table 104. Vegetational characteristics of different degradation stages of a maquis formation.
(Stamou and Pantis 1995)
Structural characteristics of vegetation
Stage 1 Stage 2 Stage 3 Stage 4 Stage 5
Cover of woody plants (%)
71
58
45
51
6
Cover of herbaceous plants (%)
19
12
15
24
54
Cover of desirable plants (%)
80
50
4
10
8
Cover ofless desirable plants (%)
3
5
6
5
7
Cover of non-desirable plants (%)
7
15
50
60
45
Total plant cover (%)
90
70
60
75
60
No. of woody species
10
10
6
4
3
No. of herbaceous species
15
14
18
22
23
Mean vegetation height (m)
2.5
0.8
0.5
0.3
0.7
fire, and more specifically the frequency of fire, are the most important selective forces to condition the responses of vegetation to other human effects.
Finally, they reformulated the drought hypothesis suggesting that summer
drought, along with frequent natural disturbances, results in higher resilience
in response to human induced effects.
Figure 1.8 shows a qualitative degradation model based on Pant is and
Mardiris (1992) and modified slightly by Stamou and Pantis (1995). Model
building was based upon the structural characteristics of the communities as
well as similarity indices. The structural features of vegetation in different
degradation stages are shown in Table 1.4. Three paths of degradation are
depicted, all initiated from an undisturbed dense maquis community dominated by Q. coccifera. The first path is modulated only by grazing and leads
0>
c:
.~
(I)
~
,....-_...L_....., low frequency fires
L-.-....,..----Ilow grazing
High frequency fires
L...-_....,.._----' Moderate grazing
r--~-~low frequency fires
L------fOvergrazing
Introduction
Fig. 1.8. Degradation process of maquis ecosystems induced by grazing and fire. Shaded blocks
stand for the final degradation stages (Stamou and Pantis 1995)
Table 104. Vegetational characteristics of different degradation stages of a maquis formation.
(Stamou and Pantis 1995)
Structural characteristics of vegetation
Stage 1 Stage 2 Stage 3 Stage 4 Stage 5
Cover of woody plants (%)
71
58
45
51
6
Cover of herbaceous plants (%)
19
12
15
24
54
Cover of desirable plants (%)
80
50
4
10
8
Cover ofless desirable plants (%)
3
5
6
5
7
Cover of non-desirable plants (%)
7
15
50
60
45
Total plant cover (%)
90
70
60
75
60
No. of woody species
10
10
6
4
3
No. of herbaceous species
15
14
18
22
23
Mean vegetation height (m)
2.5
0.8
0.5
0.3
0.7
fire, and more specifically the frequency of fire, are the most important selective forces to condition the responses of vegetation to other human effects.
Finally, they reformulated the drought hypothesis suggesting that summer
drought, along with frequent natural disturbances, results in higher resilience
in response to human induced effects.
Figure 1.8 shows a qualitative degradation model based on Pant is and
Mardiris (1992) and modified slightly by Stamou and Pantis (1995). Model
building was based upon the structural characteristics of the communities as
well as similarity indices. The structural features of vegetation in different
degradation stages are shown in Table 1.4. Three paths of degradation are
depicted, all initiated from an undisturbed dense maquis community dominated by Q. coccifera. The first path is modulated only by grazing and leads