

104
Community Structure
Table 7.4. Numerical responses to fire of some soil dwelling macroarthropods of a phryganic
ecosystem. (Sgardelis 1988)
Taxonomic group
Julidae
Insect larvae
Coleoptera
Isopoda, Geophilomorpha, Aranae
~: decreasing numbers
,,: increasing numbers
+: constant numbers
~: unaffected
4
2
- - '"
'>( 0
<
-2
-4
-6
-6
-4
-2
1st year
o
Axis I
NI
2
2nd year
~J~
F2
01
4
6
8
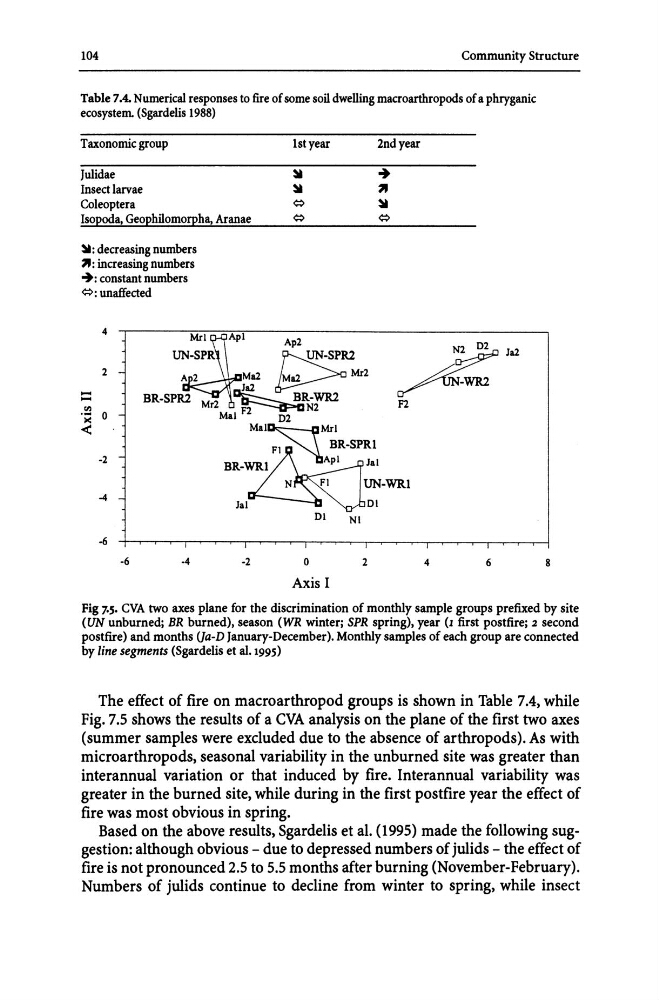
Fig 7.S. CVA two axes plane for the discrimination of monthly sample groups prefixed by site
(UN unburned; BR burned), season (WR winter; SPR spring), year (1 first postfire; 2 second
postfire) and months (Ja-D January-December). Monthly samples of each group are connected
by line segments (Sgardelis et al.1995)
The effect of fire on macroarthropod groups is shown in Table 7.4, while
Fig. 7.5 shows the results of a eVA analysis on the plane of the first two axes
(summer samples were excluded due to the absence of arthropods). As with
micro arthropods, seasonal variability in the unburned site was greater than
interannual variation or that induced by fire. Interannual variability was
greater in the burned site, while during in the first postfire year the effect of
fire was most obvious in spring.
Based on the above results, Sgardelis et al. (1995) made the following suggestion: although obvious - due to depressed numbers of julids - the effect of
fire is not pronounced 2.5 to 5.5 months after burning (November-February).
Numbers of julids continue to decline from winter to spring, while insect
Community Structure
Table 7.4. Numerical responses to fire of some soil dwelling macroarthropods of a phryganic
ecosystem. (Sgardelis 1988)
Taxonomic group
Julidae
Insect larvae
Coleoptera
Isopoda, Geophilomorpha, Aranae
~: decreasing numbers
,,: increasing numbers
+: constant numbers
~: unaffected
4
2
- - '"
'>( 0
<
-2
-4
-6
-6
-4
-2
1st year
o
Axis I
NI
2
2nd year
~J~
F2
01
4
6
8
Fig 7.S. CVA two axes plane for the discrimination of monthly sample groups prefixed by site
(UN unburned; BR burned), season (WR winter; SPR spring), year (1 first postfire; 2 second
postfire) and months (Ja-D January-December). Monthly samples of each group are connected
by line segments (Sgardelis et al.1995)
The effect of fire on macroarthropod groups is shown in Table 7.4, while
Fig. 7.5 shows the results of a eVA analysis on the plane of the first two axes
(summer samples were excluded due to the absence of arthropods). As with
micro arthropods, seasonal variability in the unburned site was greater than
interannual variation or that induced by fire. Interannual variability was
greater in the burned site, while during in the first postfire year the effect of
fire was most obvious in spring.
Based on the above results, Sgardelis et al. (1995) made the following suggestion: although obvious - due to depressed numbers of julids - the effect of
fire is not pronounced 2.5 to 5.5 months after burning (November-February).
Numbers of julids continue to decline from winter to spring, while insect