

30
J. Haure et al.
(Le Grel and Le Bihan 2009) according to a number of criteria, among which the
most relevant in terms of phycotoxin contamination were: (i) the size of the oyster
farm and (ii) the producer’s perception of risk:
– Group 1: farms located in several areas, with high production levels to meet
demands from different distribution networks;
– Group 2: family farms with local outlets and no investment dynamics, run by
farmers who are nearly retired;
– Group 3: young farmers running family concerns in a growth phase.
Results
Water Treatment
The first objective was to remove any toxin producing cells from the re-circulating
seawater system. Two possible filtration processes were tested:
– Sand filters, which are already on the market, cheap and generally favoured by
the producers
– Membrane filters, which are more expensive but more reliable.
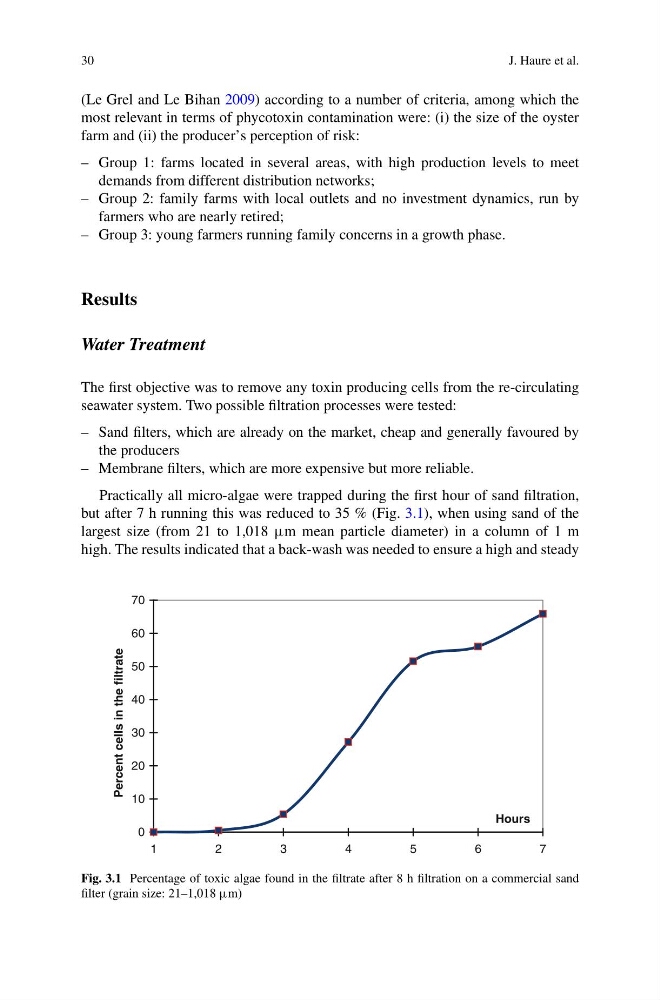
Practically all micro-algae were trapped during the first hour of sand filtration,
but after 7 h running this was reduced to 35 % (Fig. 3.1), when using sand of the
largest size (from 21 to 1,018 m mean particle diameter) in a column of 1 m
high. The results indicated that a back-wash was needed to ensure a high and steady
0
10
20
30
40
50
60
70
1
2
3
4
5
6
7
Hours
Percent cells in the filtrate
Fig. 3.1 Percentage of toxic algae found in the filtrate after 8 h filtration on a commercial sand
filter (grain size: 21–1,018 m)
J. Haure et al.
(Le Grel and Le Bihan 2009) according to a number of criteria, among which the
most relevant in terms of phycotoxin contamination were: (i) the size of the oyster
farm and (ii) the producer’s perception of risk:
– Group 1: farms located in several areas, with high production levels to meet
demands from different distribution networks;
– Group 2: family farms with local outlets and no investment dynamics, run by
farmers who are nearly retired;
– Group 3: young farmers running family concerns in a growth phase.
Results
Water Treatment
The first objective was to remove any toxin producing cells from the re-circulating
seawater system. Two possible filtration processes were tested:
– Sand filters, which are already on the market, cheap and generally favoured by
the producers
– Membrane filters, which are more expensive but more reliable.
Practically all micro-algae were trapped during the first hour of sand filtration,
but after 7 h running this was reduced to 35 % (Fig. 3.1), when using sand of the
largest size (from 21 to 1,018 m mean particle diameter) in a column of 1 m
high. The results indicated that a back-wash was needed to ensure a high and steady
0
10
20
30
40
50
60
70
1
2
3
4
5
6
7
Hours
Percent cells in the filtrate
Fig. 3.1 Percentage of toxic algae found in the filtrate after 8 h filtration on a commercial sand
filter (grain size: 21–1,018 m)