

192
T.S. Guldberg et al.
Table 16.2 Comparison of normalized calibration slopes of methanol standard curves
Mean slope variance (%)
Toxin
Internal
standard
No. of calibration
curves
Area 95 % CI
Ratio 95 % CI
P-value
OA
DHO
20
4:2 1.2 to 9.7
1:7 1.3 to 4.7
0.442
DTX-1 DHO
20
4:0 3.0 to 11.0
2:4 3.5 to 8.3
0.725
YTX
DHO
20
2:3 8.2 to 3.7
3:8 8.9 to 1.4
0.628
PTX-2 Pent-PBI 13
4:5 13.9 to 5.0
1:0 9.2 to 7.1
0.596
Hep-PBI 13
3:6 6.1 to 13.2 0.261
Aza-1
Pent-PBI 13
6:4 9.8 to 3.0 2:7 5.6 to 0.2
0.128
Hep-PBI 13
1:8 1.6 to 5.2
0.005
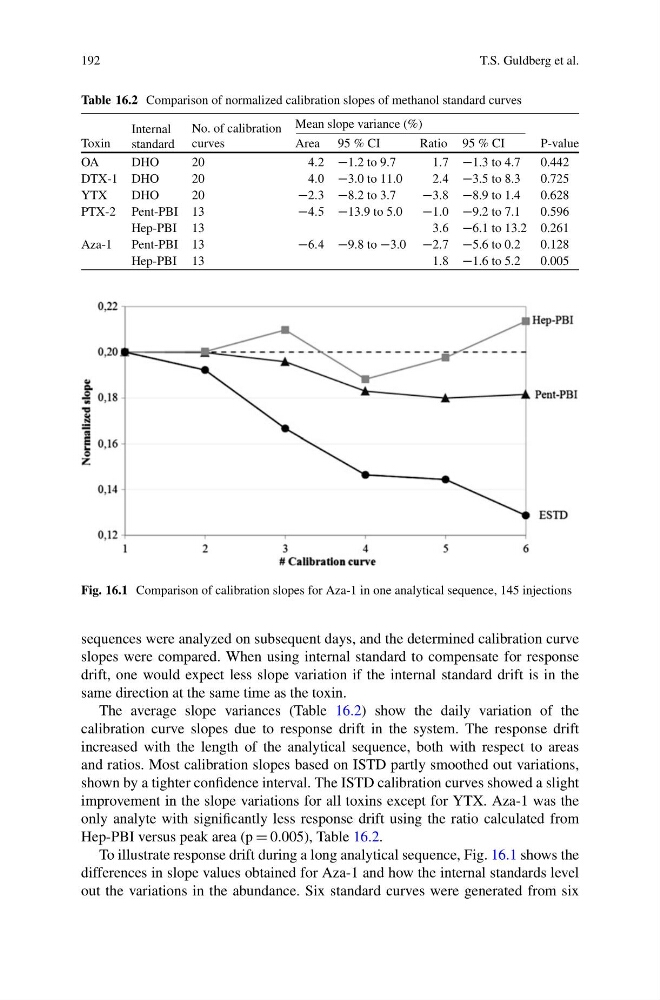
Fig. 16.1 Comparison of calibration slopes for Aza-1 in one analytical sequence, 145 injections
sequences were analyzed on subsequent days, and the determined calibration curve
slopes were compared. When using internal standard to compensate for response
drift, one would expect less slope variation if the internal standard drift is in the
same direction at the same time as the toxin.
The average slope variances (Table 16.2) show the daily variation of the
calibration curve slopes due to response drift in the system. The response drift
increased with the length of the analytical sequence, both with respect to areas
and ratios. Most calibration slopes based on ISTD partly smoothed out variations,
shown by a tighter confidence interval. The ISTD calibration curves showed a slight
improvement in the slope variations for all toxins except for YTX. Aza-1 was the
only analyte with significantly less response drift using the ratio calculated from
Hep-PBI versus peak area (p D 0.005), Table 16.2.
To illustrate response drift during a long analytical sequence, Fig. 16.1 shows the
differences in slope values obtained for Aza-1 and how the internal standards level
out the variations in the abundance. Six standard curves were generated from six
T.S. Guldberg et al.
Table 16.2 Comparison of normalized calibration slopes of methanol standard curves
Mean slope variance (%)
Toxin
Internal
standard
No. of calibration
curves
Area 95 % CI
Ratio 95 % CI
P-value
OA
DHO
20
4:2 1.2 to 9.7
1:7 1.3 to 4.7
0.442
DTX-1 DHO
20
4:0 3.0 to 11.0
2:4 3.5 to 8.3
0.725
YTX
DHO
20
2:3 8.2 to 3.7
3:8 8.9 to 1.4
0.628
PTX-2 Pent-PBI 13
4:5 13.9 to 5.0
1:0 9.2 to 7.1
0.596
Hep-PBI 13
3:6 6.1 to 13.2 0.261
Aza-1
Pent-PBI 13
6:4 9.8 to 3.0 2:7 5.6 to 0.2
0.128
Hep-PBI 13
1:8 1.6 to 5.2
0.005
Fig. 16.1 Comparison of calibration slopes for Aza-1 in one analytical sequence, 145 injections
sequences were analyzed on subsequent days, and the determined calibration curve
slopes were compared. When using internal standard to compensate for response
drift, one would expect less slope variation if the internal standard drift is in the
same direction at the same time as the toxin.
The average slope variances (Table 16.2) show the daily variation of the
calibration curve slopes due to response drift in the system. The response drift
increased with the length of the analytical sequence, both with respect to areas
and ratios. Most calibration slopes based on ISTD partly smoothed out variations,
shown by a tighter confidence interval. The ISTD calibration curves showed a slight
improvement in the slope variations for all toxins except for YTX. Aza-1 was the
only analyte with significantly less response drift using the ratio calculated from
Hep-PBI versus peak area (p D 0.005), Table 16.2.
To illustrate response drift during a long analytical sequence, Fig. 16.1 shows the
differences in slope values obtained for Aza-1 and how the internal standards level
out the variations in the abundance. Six standard curves were generated from six