

190
T.S. Guldberg et al.
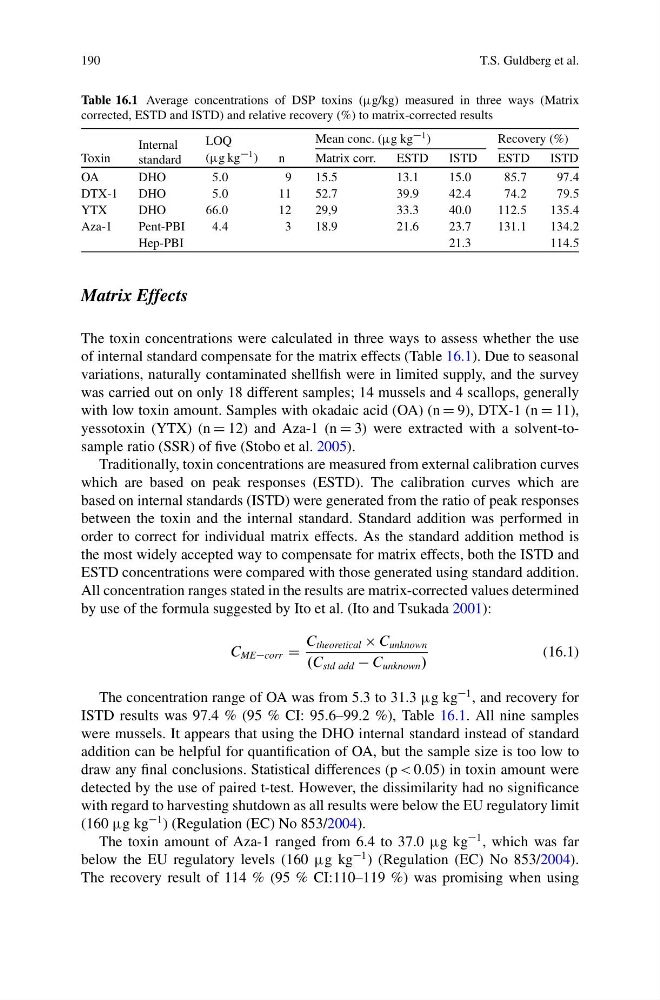
Table 16.1 Average concentrations of DSP toxins (g/kg) measured in three ways (Matrix
corrected, ESTD and ISTD) and relative recovery (%) to matrix-corrected results
Internal
standard
LOQ
(g kg
1 )
Mean conc. (g kg
1 )
Recovery (%)
Toxin
n
Matrix corr.
ESTD
ISTD
ESTD
ISTD
OA
DHO
5:0
9
15.5
13.1
15.0
85:7
97:4
DTX-1
DHO
5:0
11
52.7
39.9
42.4
74:2
79:5
YTX
DHO
66:0
12
29,9
33.3
40.0
112:5
135:4
Aza-1
Pent-PBI
4:4
3
18.9
21.6
23.7
131:1
134:2
Hep-PBI
21.3
114:5
Matrix Effects
The toxin concentrations were calculated in three ways to assess whether the use
of internal standard compensate for the matrix effects (Table 16.1). Due to seasonal
variations, naturally contaminated shellfish were in limited supply, and the survey
was carried out on only 18 different samples; 14 mussels and 4 scallops, generally
with low toxin amount. Samples with okadaic acid (OA) (n D 9), DTX-1 (n D 11),
yessotoxin (YTX) (n D 12) and Aza-1 (n D 3) were extracted with a solvent-tosample ratio (SSR) of five (Stobo et al. 2005).
Traditionally, toxin concentrations are measured from external calibration curves
which are based on peak responses (ESTD). The calibration curves which are
based on internal standards (ISTD) were generated from the ratio of peak responses
between the toxin and the internal standard. Standard addition was performed in
order to correct for individual matrix effects. As the standard addition method is
the most widely accepted way to compensate for matrix effects, both the ISTD and
ESTD concentrations were compared with those generated using standard addition.
All concentration ranges stated in the results are matrix-corrected values determined
by use of the formula suggested by Ito et al. (Ito and Tsukada 2001):
C MEcorr D
C theoretical C unknown
.C std add C unknown /
(16.1)
The concentration range of OA was from 5.3 to 31.3 g kg
1 , and recovery for
ISTD results was 97.4 % (95 % CI: 95.6–99.2 %), Table 16.1. All nine samples
were mussels. It appears that using the DHO internal standard instead of standard
addition can be helpful for quantification of OA, but the sample size is too low to
draw any final conclusions. Statistical differences (p < 0.05) in toxin amount were
detected by the use of paired t-test. However, the dissimilarity had no significance
with regard to harvesting shutdown as all results were below the EU regulatory limit
(160 g kg
1 ) (Regulation (EC) No 853/2004).
The toxin amount of Aza-1 ranged from 6.4 to 37.0 g kg
1 , which was far
below the EU regulatory levels (160 g kg
1 ) (Regulation (EC) No 853/2004).
The recovery result of 114 % (95 % CI:110–119 %) was promising when using
T.S. Guldberg et al.
Table 16.1 Average concentrations of DSP toxins (g/kg) measured in three ways (Matrix
corrected, ESTD and ISTD) and relative recovery (%) to matrix-corrected results
Internal
standard
LOQ
(g kg
1 )
Mean conc. (g kg
1 )
Recovery (%)
Toxin
n
Matrix corr.
ESTD
ISTD
ESTD
ISTD
OA
DHO
5:0
9
15.5
13.1
15.0
85:7
97:4
DTX-1
DHO
5:0
11
52.7
39.9
42.4
74:2
79:5
YTX
DHO
66:0
12
29,9
33.3
40.0
112:5
135:4
Aza-1
Pent-PBI
4:4
3
18.9
21.6
23.7
131:1
134:2
Hep-PBI
21.3
114:5
Matrix Effects
The toxin concentrations were calculated in three ways to assess whether the use
of internal standard compensate for the matrix effects (Table 16.1). Due to seasonal
variations, naturally contaminated shellfish were in limited supply, and the survey
was carried out on only 18 different samples; 14 mussels and 4 scallops, generally
with low toxin amount. Samples with okadaic acid (OA) (n D 9), DTX-1 (n D 11),
yessotoxin (YTX) (n D 12) and Aza-1 (n D 3) were extracted with a solvent-tosample ratio (SSR) of five (Stobo et al. 2005).
Traditionally, toxin concentrations are measured from external calibration curves
which are based on peak responses (ESTD). The calibration curves which are
based on internal standards (ISTD) were generated from the ratio of peak responses
between the toxin and the internal standard. Standard addition was performed in
order to correct for individual matrix effects. As the standard addition method is
the most widely accepted way to compensate for matrix effects, both the ISTD and
ESTD concentrations were compared with those generated using standard addition.
All concentration ranges stated in the results are matrix-corrected values determined
by use of the formula suggested by Ito et al. (Ito and Tsukada 2001):
C MEcorr D
C theoretical C unknown
.C std add C unknown /
(16.1)
The concentration range of OA was from 5.3 to 31.3 g kg
1 , and recovery for
ISTD results was 97.4 % (95 % CI: 95.6–99.2 %), Table 16.1. All nine samples
were mussels. It appears that using the DHO internal standard instead of standard
addition can be helpful for quantification of OA, but the sample size is too low to
draw any final conclusions. Statistical differences (p < 0.05) in toxin amount were
detected by the use of paired t-test. However, the dissimilarity had no significance
with regard to harvesting shutdown as all results were below the EU regulatory limit
(160 g kg
1 ) (Regulation (EC) No 853/2004).
The toxin amount of Aza-1 ranged from 6.4 to 37.0 g kg
1 , which was far
below the EU regulatory levels (160 g kg
1 ) (Regulation (EC) No 853/2004).
The recovery result of 114 % (95 % CI:110–119 %) was promising when using