

10 Probabilistic Exposure Assessment to Phycotoxins by Recreational. . .
115
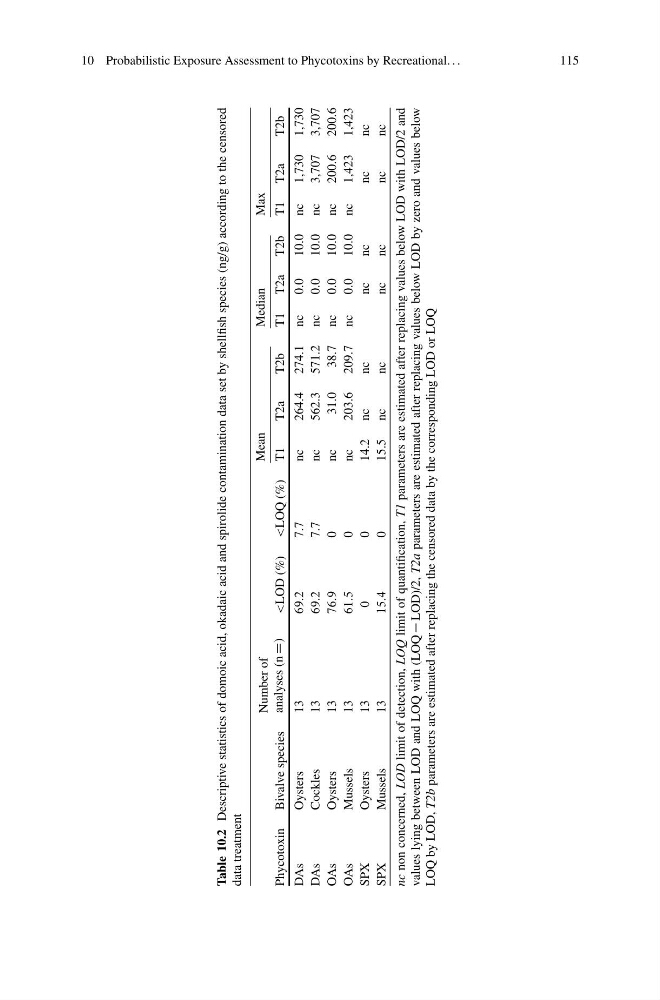
Table 10.2
Descriptive statistics of domoic acid, okadaic acid and spirolide contamination data set by shellfish species (ng/g) according to the censored
data treatment
Mean
Median
Max
Phycotoxin Bivalve species
Number of
analyses (n
D)
T2b
T1 T2a T2b
T1 T2a
T2b
DAs
Oysters
13
69:2
7.7
nc
264.4 274.1 nc
0.0
10.0 nc
1,730 1,730
DAs
Cockles
13
69:2
7.7
nc
562.3 571.2 nc
0.0
10.0 nc
3,707 3,707
OAs
Oysters
13
76:9
0
nc
31.0
38.7 nc
0.0
10.0 nc
200.6 200.6
OAs
Mussels
13
61:5
0
nc
203.6 209.7 nc
0.0
10.0 nc
1,423 1,423
SPX
Oysters
13
0
0
1 4 . 2 n c
n c
n c
n c
n c
n c
SPX
Mussels
13
15:4
0
1 5 . 5 n c
n c
n c
n c
n c
n c
nc
non concerned, LOD
limit of detection, LOQ
limit of quantification, T1
parameters are estimated after replacing values below LOD with LOD/2 and
values lying between LOD and LOQ with (LOQ
LOD)/2, T2a
parameters are estimated after replacing values below LOD by zero and values below
LOQ by LOD, T2b
parameters are estimated after replacing the censored data by the corresponding LOD or LOQ
115
Table 10.2
Descriptive statistics of domoic acid, okadaic acid and spirolide contamination data set by shellfish species (ng/g) according to the censored
data treatment
Mean
Median
Max
Phycotoxin Bivalve species
Number of
analyses (n
D)
T2b
T1 T2a T2b
T1 T2a
T2b
DAs
Oysters
13
69:2
7.7
nc
264.4 274.1 nc
0.0
10.0 nc
1,730 1,730
DAs
Cockles
13
69:2
7.7
nc
562.3 571.2 nc
0.0
10.0 nc
3,707 3,707
OAs
Oysters
13
76:9
0
nc
31.0
38.7 nc
0.0
10.0 nc
200.6 200.6
OAs
Mussels
13
61:5
0
nc
203.6 209.7 nc
0.0
10.0 nc
1,423 1,423
SPX
Oysters
13
0
0
1 4 . 2 n c
n c
n c
n c
n c
n c
SPX
Mussels
13
15:4
0
1 5 . 5 n c
n c
n c
n c
n c
n c
nc
non concerned, LOD
limit of detection, LOQ
limit of quantification, T1
parameters are estimated after replacing values below LOD with LOD/2 and
values lying between LOD and LOQ with (LOQ
LOD)/2, T2a
parameters are estimated after replacing values below LOD by zero and values below
LOQ by LOD, T2b
parameters are estimated after replacing the censored data by the corresponding LOD or LOQ