

78
Herbivores and Algae: Food Utilization, Growth and Reproduction ...
Most published ingestion rate measurements on Daphnia have been
presented as allometric functions of body length, with an exponent around
2-3 (e.g., Burns and Rigler 1967; Geller 1975; DeMott 1982; Ganf and Shiel
1985). When such measurements are rescaled to body-mass-specific rates
as function of body mass, much of the non-linearity disappears, giving
functional relationships that might as well be represented by straight lines.
As an example, one can compare the ingestion rates reported by Geller
(1975) for Daphnia pulex feeding on high and low concentrations of
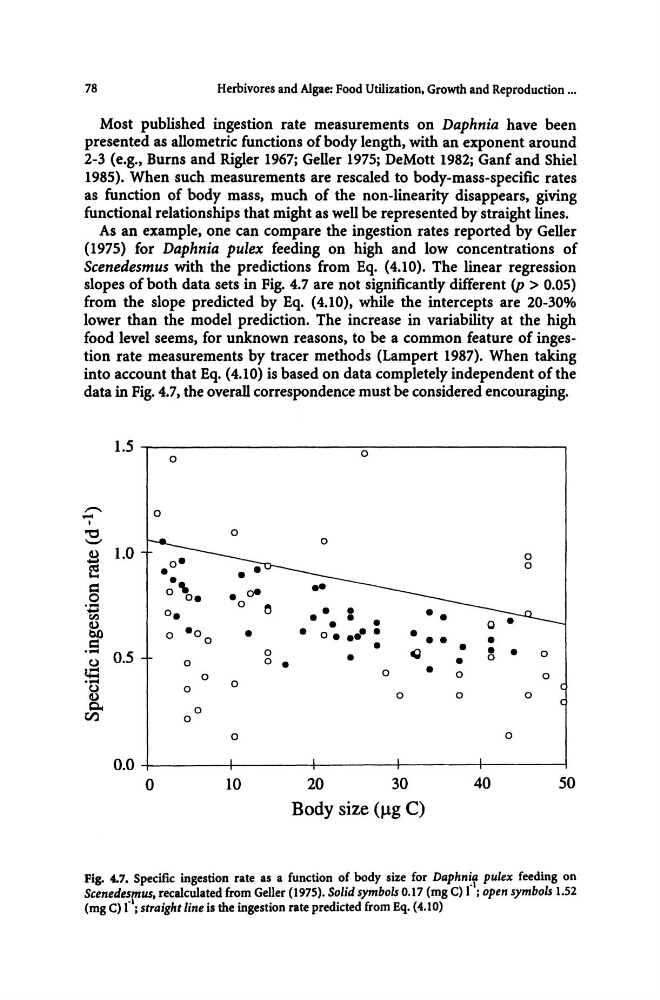
Scenedesmus with the predictions from Eq. (4.10). The linear regression
slopes of both data sets in Fig. 4.7 are not significantly different (p > 0.05)
from the slope predicted by Eq. (4.10), while the intercepts are 20-30%
lower than the model prediction. The increase in variability at the high
food level seems, for unknown reasons, to be a common feature of ingestion rate measurements by tracer methods (Lampert 1987). When taking
into account that Eq. (4.10) is based on data completely independent of the
data in Fig. 4.7, the overall correspondence must be considered encouraging.
I.S
0
0
,.......
0
-
I
"0
0
-0
B 1.0
0
e
0
=
• oe
0
.0
0
:
-
o.
•
en
•
•
0
•
~
0 · 0
•
• o • • 1' • •
0
•• •
•
• •
. - O.S
0
~
• 0
u
0
0
•
•
0
•
I.d
0
• 0
0
0
."""
0
u
0
0
0
0
0
c.
0
tI)
0
0
0
0.0
0
10
20
30
40
SO
Body size (J.1g C)
Pig. 4.7. Specific ingestion rate as a function of body size for Daphn~f pulex feeding on
Scenedesmus, recalculated from Geller (1975). Solid symbols 0.17 (mg C) 1 ; open symbols 1.52
(mg C) [I; straight line is the ingestion rate predicted from Eq. (4.10)
Herbivores and Algae: Food Utilization, Growth and Reproduction ...
Most published ingestion rate measurements on Daphnia have been
presented as allometric functions of body length, with an exponent around
2-3 (e.g., Burns and Rigler 1967; Geller 1975; DeMott 1982; Ganf and Shiel
1985). When such measurements are rescaled to body-mass-specific rates
as function of body mass, much of the non-linearity disappears, giving
functional relationships that might as well be represented by straight lines.
As an example, one can compare the ingestion rates reported by Geller
(1975) for Daphnia pulex feeding on high and low concentrations of
Scenedesmus with the predictions from Eq. (4.10). The linear regression
slopes of both data sets in Fig. 4.7 are not significantly different (p > 0.05)
from the slope predicted by Eq. (4.10), while the intercepts are 20-30%
lower than the model prediction. The increase in variability at the high
food level seems, for unknown reasons, to be a common feature of ingestion rate measurements by tracer methods (Lampert 1987). When taking
into account that Eq. (4.10) is based on data completely independent of the
data in Fig. 4.7, the overall correspondence must be considered encouraging.
I.S
0
0
,.......
0
-
I
"0
0
-0
B 1.0
0
e
0
=
• oe
0
.0
0
:
-
o.
•
en
•
•
0
•
~
0 · 0
•
• o • • 1' • •
0
•• •
•
• •
. - O.S
0
~
• 0
u
0
0
•
•
0
•
I.d
0
• 0
0
0
."""
0
u
0
0
0
0
0
c.
0
tI)
0
0
0
0.0
0
10
20
30
40
SO
Body size (J.1g C)
Pig. 4.7. Specific ingestion rate as a function of body size for Daphn~f pulex feeding on
Scenedesmus, recalculated from Geller (1975). Solid symbols 0.17 (mg C) 1 ; open symbols 1.52
(mg C) [I; straight line is the ingestion rate predicted from Eq. (4.10)