

56
Algae and Nutrients: Uptake and Utilization of Limiting ...
If we exchange the roles of species 1 and 2 (such that species 1 becomes the
superior competitor for N and species 2 for P), the corresponding feasible region for coexistence would be a reflection across the diagonal line of the region
in Fig. 3.9. The feasible region vanishes whenever Q~/Q~.I ~ Q',./Q',.I - thus, a
necessary condition for coexistence must be that Q' N.2 IQ'N.I< Q',.2IQ'P.I' or Q'N.2
IQ'P.2< Q~IIQ',.I' which means that species 1 must have the highest "optimum"
N:P ratio (sensu Rhee and Gotham (1980».
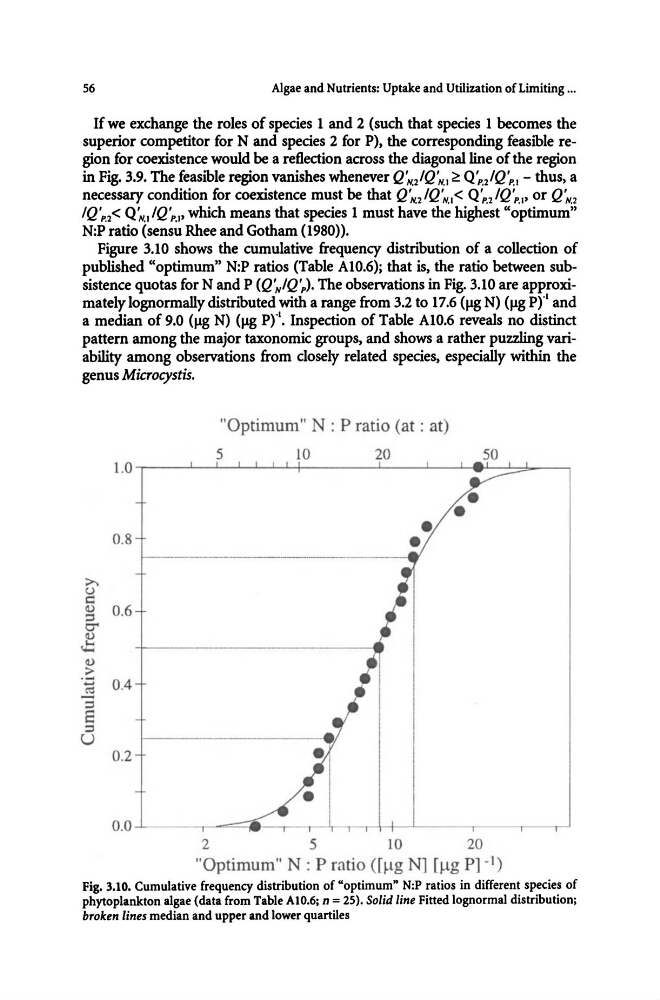
Figure 3.10 shows the cumulative frequency distribution of a collection of
published "optimum" N:P ratios (Table AI0.6); that is, the ratio between subsistence quotas for Nand P (Q'iQ',). The observations in Fig. 3.10 are approximately lognormally distributed with a range from 3.2 to 17.6 (J.l8 N) (~g prl and
a median of 9.0 (~g N) (J.l8 pr'. Inspection of Table AI0.6 reveals no distinct
pattern among the major taxonomic groups, and shows a rather puzzling variability among observations from closely related species, especially within the
genus Microcystis.
"Optimum" N : P ratio (at: at)
5
10
20
50
1.0 --.-----'--'---..L...-L.......1--'--I----..L...----'--~~--.L::=d_-__,
;>,
<.)
c::
0.8
g 0.6
0"'
C1}
J::;
C1}
.:: ~ 0.4
- ::I
8
::I
U
0.2
0.0
2
5
10
20
"Optimum" N : P ratio (fMg Nl [Mg P] -1)
Fig. 3.10. Cumulative frequency distribution of "optimum" N:P ratios in different species of
phytoplankton algae (data from Table AIO.6; n = 25). Solid line Fitted lognormal distribution;
broken lines median and upper and lower quartiles
Algae and Nutrients: Uptake and Utilization of Limiting ...
If we exchange the roles of species 1 and 2 (such that species 1 becomes the
superior competitor for N and species 2 for P), the corresponding feasible region for coexistence would be a reflection across the diagonal line of the region
in Fig. 3.9. The feasible region vanishes whenever Q~/Q~.I ~ Q',./Q',.I - thus, a
necessary condition for coexistence must be that Q' N.2 IQ'N.I< Q',.2IQ'P.I' or Q'N.2
IQ'P.2< Q~IIQ',.I' which means that species 1 must have the highest "optimum"
N:P ratio (sensu Rhee and Gotham (1980».
Figure 3.10 shows the cumulative frequency distribution of a collection of
published "optimum" N:P ratios (Table AI0.6); that is, the ratio between subsistence quotas for Nand P (Q'iQ',). The observations in Fig. 3.10 are approximately lognormally distributed with a range from 3.2 to 17.6 (J.l8 N) (~g prl and
a median of 9.0 (~g N) (J.l8 pr'. Inspection of Table AI0.6 reveals no distinct
pattern among the major taxonomic groups, and shows a rather puzzling variability among observations from closely related species, especially within the
genus Microcystis.
"Optimum" N : P ratio (at: at)
5
10
20
50
1.0 --.-----'--'---..L...-L.......1--'--I----..L...----'--~~--.L::=d_-__,
;>,
<.)
c::
0.8
g 0.6
0"'
C1}
J::;
C1}
.:: ~ 0.4
- ::I
8
::I
U
0.2
0.0
2
5
10
20
"Optimum" N : P ratio (fMg Nl [Mg P] -1)
Fig. 3.10. Cumulative frequency distribution of "optimum" N:P ratios in different species of
phytoplankton algae (data from Table AIO.6; n = 25). Solid line Fitted lognormal distribution;
broken lines median and upper and lower quartiles