

Phytoplankton growth model parametrization
47
The Chlorophyll: Carbon Ratio. The maintenance costs appear to be quite
low in microalgae, with many estimates being not significantly different
from zero (Geider 1987). A fairly reasonable value for the maintenance rate
in Eq. (3.16) seems to be Po = 0.05 day"\ corresponding to the maintenance
rate found by Laws et al. (1983), for both light- and nutrient-limited cultures of Thalassiosira weisjlogii. According to the theory of Shuter (1979),
the maximum chla:C ratio for nutrient-limited growth (cp', could equally
well be estimated as the minimum chla:C ratio for light-limited growth.
Table AI0.5 shows a collection of cp' estimates from different phytoplankton species. obtained under either light- or nutrient-limited growth. The cp'
values in Table AI0.5 vary by more than an order of magnitude, with the
lowest value found in the slowly growing marine dinoflagellate Proroeentrum
mieans. The median of the data in Table AI0.5 is 18 (~g chla) (mg ct with
an interquartile range from 12 to 20 (~g chla) (mg ct.
Properties of Generalized Phytoplankton Species. It is recognized that the
diversity of experimental conditions underlying the individual entries in
Tables AI0.1 to AI0.4 is a potential source of bias in the parameter distributions. and that such bias is most likely to affect the extremes of the distribution. A more robust measure of parameter variability would be to consider
the upper and lower quartiles of the distribution, which can also be
interpreted as the median of the values below the median and the median of
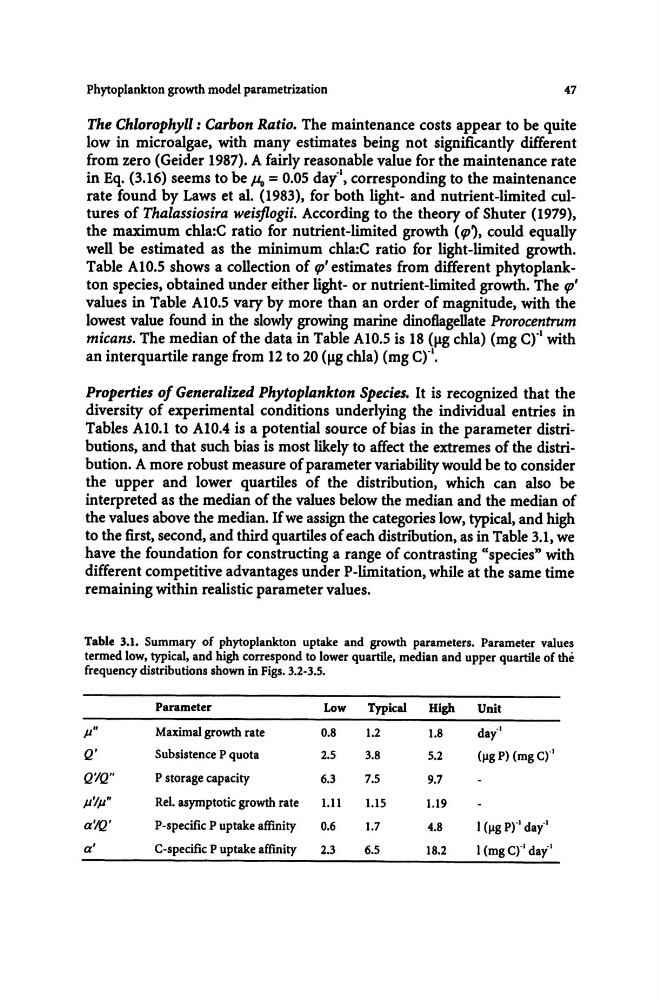
the values above the median. If we assign the categories low, typical, and high
to the first, second, and third quartiles of each distnbution, as in Table 3.1, we
have the foundation for constructing a range of contrasting "species" with
different competitive advantages under P-limitation, while at the same time
remaining within realistic parameter values.
Table 3.1. Summary of phytoplankton uptake and growth parameters. Parameter values
termed low. typical. and high correspond to lower quartile. median and upper quartile of the
frequency distributions shown in Figs. 3.2-3.5.
Parameter
Low
Typical
High
Unit
p"
Maximal growth rate
O.S
1.2
I.S
day·'
Q'
Subsistence P quota
2.5
3.S
5.2
(j.lg P) (mg crt
Q'lQ"
P storage capacity
6.3
7.5
9.7
p'/p"
ReI. asymptotic growth rate
1.11
1.15
1.19
a'IQ'
P-specific P uptake affinity
0.6
1.7
4.S
I (j.lg pr' day"'
a'
C-specific P uptake affmity
2.3
6.5
IS.2
I (mg crt day"'
47
The Chlorophyll: Carbon Ratio. The maintenance costs appear to be quite
low in microalgae, with many estimates being not significantly different
from zero (Geider 1987). A fairly reasonable value for the maintenance rate
in Eq. (3.16) seems to be Po = 0.05 day"\ corresponding to the maintenance
rate found by Laws et al. (1983), for both light- and nutrient-limited cultures of Thalassiosira weisjlogii. According to the theory of Shuter (1979),
the maximum chla:C ratio for nutrient-limited growth (cp', could equally
well be estimated as the minimum chla:C ratio for light-limited growth.
Table AI0.5 shows a collection of cp' estimates from different phytoplankton species. obtained under either light- or nutrient-limited growth. The cp'
values in Table AI0.5 vary by more than an order of magnitude, with the
lowest value found in the slowly growing marine dinoflagellate Proroeentrum
mieans. The median of the data in Table AI0.5 is 18 (~g chla) (mg ct with
an interquartile range from 12 to 20 (~g chla) (mg ct.
Properties of Generalized Phytoplankton Species. It is recognized that the
diversity of experimental conditions underlying the individual entries in
Tables AI0.1 to AI0.4 is a potential source of bias in the parameter distributions. and that such bias is most likely to affect the extremes of the distribution. A more robust measure of parameter variability would be to consider
the upper and lower quartiles of the distribution, which can also be
interpreted as the median of the values below the median and the median of
the values above the median. If we assign the categories low, typical, and high
to the first, second, and third quartiles of each distnbution, as in Table 3.1, we
have the foundation for constructing a range of contrasting "species" with
different competitive advantages under P-limitation, while at the same time
remaining within realistic parameter values.
Table 3.1. Summary of phytoplankton uptake and growth parameters. Parameter values
termed low. typical. and high correspond to lower quartile. median and upper quartile of the
frequency distributions shown in Figs. 3.2-3.5.
Parameter
Low
Typical
High
Unit
p"
Maximal growth rate
O.S
1.2
I.S
day·'
Q'
Subsistence P quota
2.5
3.S
5.2
(j.lg P) (mg crt
Q'lQ"
P storage capacity
6.3
7.5
9.7
p'/p"
ReI. asymptotic growth rate
1.11
1.15
1.19
a'IQ'
P-specific P uptake affinity
0.6
1.7
4.S
I (j.lg pr' day"'
a'
C-specific P uptake affmity
2.3
6.5
IS.2
I (mg crt day"'