

44
Algae and Nutrients: Uptake and Utilization of Limiting ...
1.0 . - - - - - - - - - - ------==-- - - - - - - ,
0.8
0.6
0.4
0.2
•
.' ,
.'
•
•
2
5
10
20
50
Phosphorus storage capacity
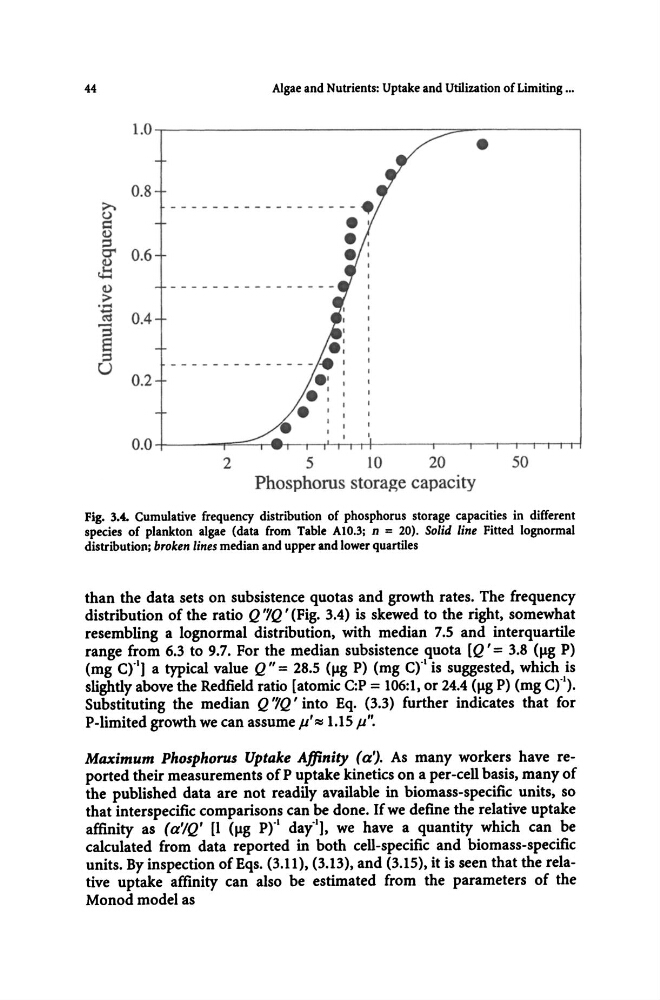
Fig. 3.4. Cumulative frequency distribution of phosphorus storage capacities in different
species of plankton algae (data from Table AIO.3; n = 20). Solid line Fitted lognormal
distribution; broken lines median and upper and lower quartiles
than the data sets on subsistence quotas and growth rates. The frequency
distribution of the ratio Q '7Q ' (Fig. 3.4) is skewed to the right, somewhat
resembling a lognormal distribution, with median 7.5 and interquartile
range from 6.3 to 9.7. For the median subsistence quota [Q' = 3.8 (Jig P)
(mg Cr'] a typical value Q" = 28.5 (Jig P) (mg Cr
l is suggested, which is
slighdyabove the Redfield ratio [atomic C:P = 106:1, or 24.4 (Jig P) (mg Cr').
Substituting the median Q '7Q' into Eq. (3.3) further indicates that for
P-limited growth we can assume ).I'P:!, 1.15 ).I".
Maximum Phosphorus Uptake Affinity (a~. As many workers have reported their measurements of P uptake kinetics on a per-cell basis, many of
the published data are not readily available in biomass-specific units, so
that interspecific comparisons can be done. If we define the relative uptake
affinity as (a'lQ' [1 (Jig pr
l day·'], we have a quantity which can be
calculated from data reported in both cell-specific and biomass-specific
units. By inspection of Eqs. (3.11), (3.13), and (3.15), it is seen that the relative uptake affinity can also be estimated from the parameters of the
Monod model as
Algae and Nutrients: Uptake and Utilization of Limiting ...
1.0 . - - - - - - - - - - ------==-- - - - - - - ,
0.8
0.6
0.4
0.2
•
.' ,
.'
•
•
2
5
10
20
50
Phosphorus storage capacity
Fig. 3.4. Cumulative frequency distribution of phosphorus storage capacities in different
species of plankton algae (data from Table AIO.3; n = 20). Solid line Fitted lognormal
distribution; broken lines median and upper and lower quartiles
than the data sets on subsistence quotas and growth rates. The frequency
distribution of the ratio Q '7Q ' (Fig. 3.4) is skewed to the right, somewhat
resembling a lognormal distribution, with median 7.5 and interquartile
range from 6.3 to 9.7. For the median subsistence quota [Q' = 3.8 (Jig P)
(mg Cr'] a typical value Q" = 28.5 (Jig P) (mg Cr
l is suggested, which is
slighdyabove the Redfield ratio [atomic C:P = 106:1, or 24.4 (Jig P) (mg Cr').
Substituting the median Q '7Q' into Eq. (3.3) further indicates that for
P-limited growth we can assume ).I'P:!, 1.15 ).I".
Maximum Phosphorus Uptake Affinity (a~. As many workers have reported their measurements of P uptake kinetics on a per-cell basis, many of
the published data are not readily available in biomass-specific units, so
that interspecific comparisons can be done. If we define the relative uptake
affinity as (a'lQ' [1 (Jig pr
l day·'], we have a quantity which can be
calculated from data reported in both cell-specific and biomass-specific
units. By inspection of Eqs. (3.11), (3.13), and (3.15), it is seen that the relative uptake affinity can also be estimated from the parameters of the
Monod model as