

172
Approaching Planktonic Food Webs: Competition, Coexistence, and Chaos
tradeoff between competitive ability and predator defence. The literature
data compiled in Table AI0.1 showed indications of such a tradeoff in the
sense that species classified as resistant to grazing either from cell or colony
dimensions or by the presence of a digestion-resistant cell envelope had a
significantly lower maximum growth rate. On a theoretical basis, several
recent models (Grover 1989; Aksnes and Egge 1991) have predicted that
large. grazing-resistant species should be inferior competitors for nutrients,
although such a tendency was not supported by the literature survey of
phosphorus uptake affinities in Table AI0.I.
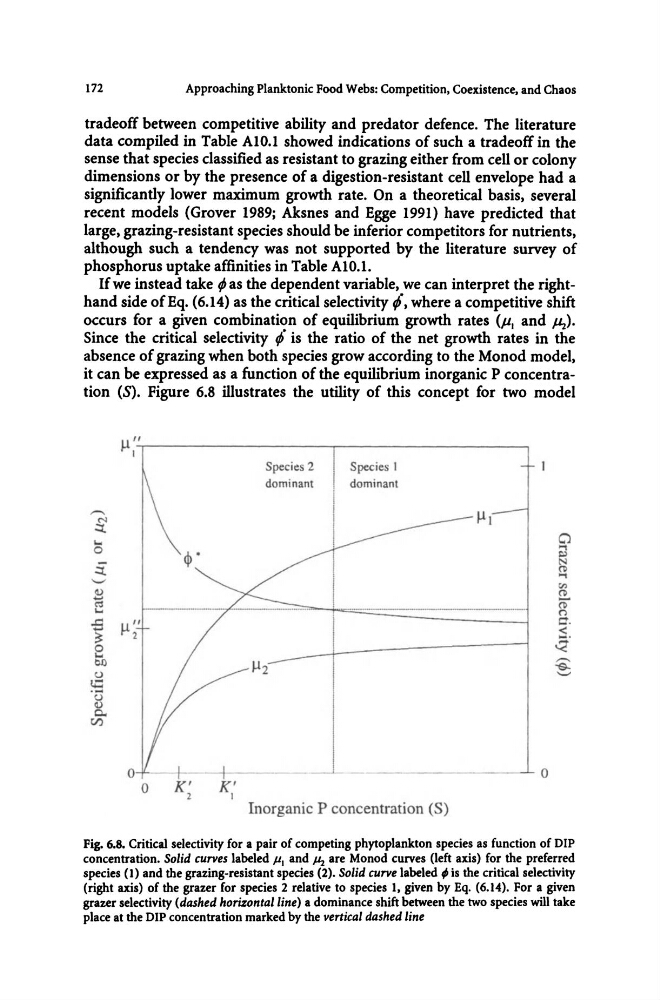
If we instead take; as the dependent variable, we can interpret the righthand side ofEq. (6.14) as the critical selectivity fl, where a competitive shift
occurs for a given combination of equilibrium growth rates (p, and J.Lz).
Since the critical selectivity ;- is the ratio of the net growth rates in the
absence of grazing when both species grow according to the Monod model,
it can be expressed as a function of the equilibrium inorganic P concentration (S). Figure 6.8 illustrates the utility of this concept for two model
....
a
-B
~
8
bJ)
u
!.O ..... u
0.
CI)
" /I
~I'----------------------'---------------------'
Species 2
dominant
Species 1
dominant
r-----..... -- -"--'-="--j """'-=-===-=-=-===-'=-=-j
J..l2
------------------~ 0
K'
K'
2
,
Inorganic P concentration (S)
Fig. 6.8. Critical selectivity for a pair of competing phytoplankton species as function of DIP
concentration. Solid curves labeled II, and ill are Monod curves (left axis) for the preferred
species (l) and the grazing-resistant species (2). Solid curve labeled; is the critical selectivity
(right axis) of the grazer for species 2 relative to species 1, given by Eq. (6.14). For a given
grazer selectivity (dashed horizontal line) a dominance shift between the two species will take
place at the DIP concentration marked by the vertical dashed line
Approaching Planktonic Food Webs: Competition, Coexistence, and Chaos
tradeoff between competitive ability and predator defence. The literature
data compiled in Table AI0.1 showed indications of such a tradeoff in the
sense that species classified as resistant to grazing either from cell or colony
dimensions or by the presence of a digestion-resistant cell envelope had a
significantly lower maximum growth rate. On a theoretical basis, several
recent models (Grover 1989; Aksnes and Egge 1991) have predicted that
large. grazing-resistant species should be inferior competitors for nutrients,
although such a tendency was not supported by the literature survey of
phosphorus uptake affinities in Table AI0.I.
If we instead take; as the dependent variable, we can interpret the righthand side ofEq. (6.14) as the critical selectivity fl, where a competitive shift
occurs for a given combination of equilibrium growth rates (p, and J.Lz).
Since the critical selectivity ;- is the ratio of the net growth rates in the
absence of grazing when both species grow according to the Monod model,
it can be expressed as a function of the equilibrium inorganic P concentration (S). Figure 6.8 illustrates the utility of this concept for two model
....
a
-B
~
8
bJ)
u
!.O ..... u
0.
CI)
" /I
~I'----------------------'---------------------'
Species 2
dominant
Species 1
dominant
r-----..... -- -"--'-="--j """'-=-===-=-=-===-'=-=-j
J..l2
------------------~ 0
K'
K'
2
,
Inorganic P concentration (S)
Fig. 6.8. Critical selectivity for a pair of competing phytoplankton species as function of DIP
concentration. Solid curves labeled II, and ill are Monod curves (left axis) for the preferred
species (l) and the grazing-resistant species (2). Solid curve labeled; is the critical selectivity
(right axis) of the grazer for species 2 relative to species 1, given by Eq. (6.14). For a given
grazer selectivity (dashed horizontal line) a dominance shift between the two species will take
place at the DIP concentration marked by the vertical dashed line