

Individual Mortality and Population Losses
95
source of survival experiments from several species of Daphnia. If we
continue to use Daphnia pulex as our model species, we can, in addition to
life-table experiments performed in ecological contexts, like Lynch (1989),
find a large base of relevant Daphnia survival data within the ecotoxicology
literature, either as control treatments or treatments where no toxic effect
was detected. Combining the survival curves from the experiments by
Lynch (1989), where population growth was found to be independent of
food level [>1 (mg C) 1"1], with survival curves from the treatments in
Winner and Farrell (1976) and Daniels and Allan (1981) where no toxic
effects were found, gives a set of 12 survival curves for Daphnia pulex
under sufficient food supply.
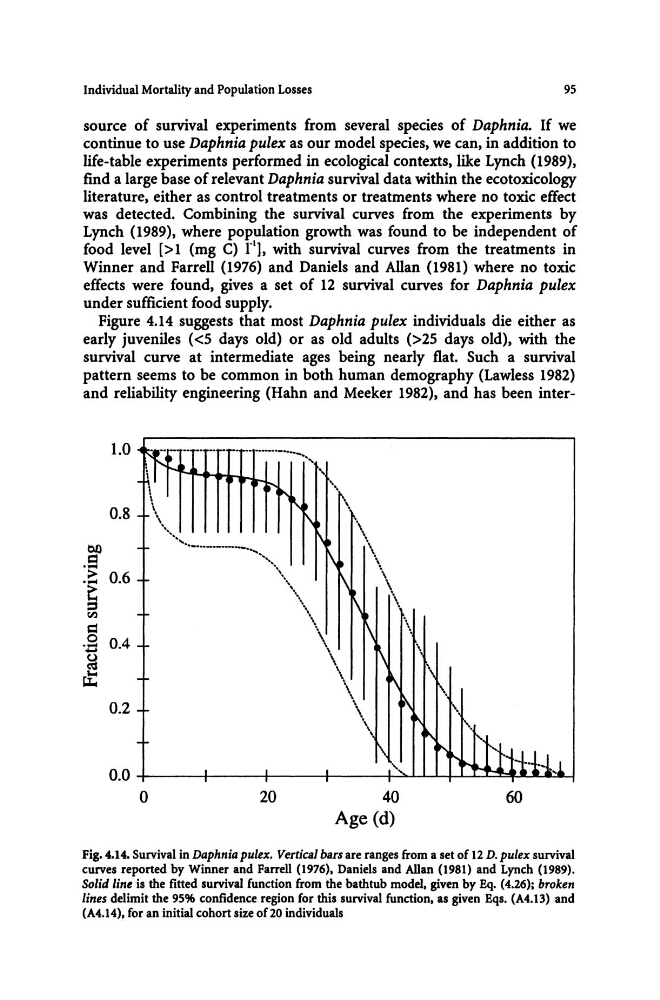
Figure 4.14 suggests that most Daphnia pulex individuals die either as
early juveniles «5 days old) or as old adults (>25 days old), with the
survival curve at intermediate ages being nearly flat. Such a survival
pattern seems to be common in both human demography (Lawless 1982)
and reliability engineering (Hahn and Meeker 1982), and has been inter1.0
0.8
bO
.S
> 0.6
.~
rI.)
§
'.;1 0.4
~
tt
0.2
\
\. '. ' . ....
. -_ .. _----,
.. _._ .... -. ..... .... ,
\
0.0 +---+---t-----t---+....:>....£-'--''-t-.L......L.....I....:J''''f-''I...II.-'--t
o
20
40
Age (d)
60
Fig. 4.14. Survival in Daphnill pulex. Vertical bars are ranges from a set of 12 D. pulex survival
curves reported by Winner and Farrell (1976), Daniels and Allan (1981) and Lynch (1989).
Solid line is the fitted survival function from the bathtub model, given by Eq. (4.26); broken
lines delimit the 95% confidence region for this survival function, as given Eqs. (A4.13) and
(A4.14), for an initial cohort size 0(20 individuals
95
source of survival experiments from several species of Daphnia. If we
continue to use Daphnia pulex as our model species, we can, in addition to
life-table experiments performed in ecological contexts, like Lynch (1989),
find a large base of relevant Daphnia survival data within the ecotoxicology
literature, either as control treatments or treatments where no toxic effect
was detected. Combining the survival curves from the experiments by
Lynch (1989), where population growth was found to be independent of
food level [>1 (mg C) 1"1], with survival curves from the treatments in
Winner and Farrell (1976) and Daniels and Allan (1981) where no toxic
effects were found, gives a set of 12 survival curves for Daphnia pulex
under sufficient food supply.
Figure 4.14 suggests that most Daphnia pulex individuals die either as
early juveniles «5 days old) or as old adults (>25 days old), with the
survival curve at intermediate ages being nearly flat. Such a survival
pattern seems to be common in both human demography (Lawless 1982)
and reliability engineering (Hahn and Meeker 1982), and has been inter1.0
0.8
bO
.S
> 0.6
.~
rI.)
§
'.;1 0.4
~
tt
0.2
\
\. '. ' . ....
. -_ .. _----,
.. _._ .... -. ..... .... ,
\
0.0 +---+---t-----t---+....:>....£-'--''-t-.L......L.....I....:J''''f-''I...II.-'--t
o
20
40
Age (d)
60
Fig. 4.14. Survival in Daphnill pulex. Vertical bars are ranges from a set of 12 D. pulex survival
curves reported by Winner and Farrell (1976), Daniels and Allan (1981) and Lynch (1989).
Solid line is the fitted survival function from the bathtub model, given by Eq. (4.26); broken
lines delimit the 95% confidence region for this survival function, as given Eqs. (A4.13) and
(A4.14), for an initial cohort size 0(20 individuals