

from Longhurst et al. (1995), Longhurst (1998), compiled by Taeger and Lazarus
(2010) (Table 16.1).
The first two axes account for 46.6 and 30.3 %, respectively, of the total variance of species-environment relation. The first axis represents a gradient from the
Caribbean and West Indies to the south. The positive extreme of the first axis is
associated with the Eastern South America region and highest mean chlorophyll
concentration in all seasons and the lowest temperatures. It is represented by the
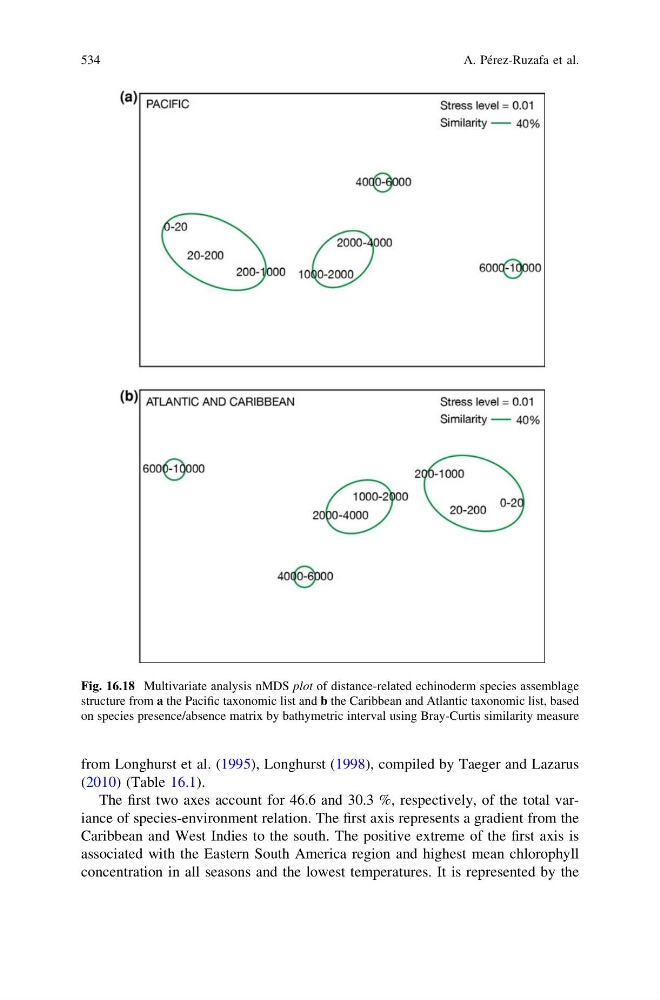
Fig. 16.18 Multivariate analysis nMDS plot of distance-related echinoderm species assemblage
structure from a the Pacific taxonomic list and b the Caribbean and Atlantic taxonomic list, based
on species presence/absence matrix by bathymetric interval using Bray-Curtis similarity measure
534
A. Pérez-Ruzafa et al.
(2010) (Table 16.1).
The first two axes account for 46.6 and 30.3 %, respectively, of the total variance of species-environment relation. The first axis represents a gradient from the
Caribbean and West Indies to the south. The positive extreme of the first axis is
associated with the Eastern South America region and highest mean chlorophyll
concentration in all seasons and the lowest temperatures. It is represented by the
Fig. 16.18 Multivariate analysis nMDS plot of distance-related echinoderm species assemblage
structure from a the Pacific taxonomic list and b the Caribbean and Atlantic taxonomic list, based
on species presence/absence matrix by bathymetric interval using Bray-Curtis similarity measure
534
A. Pérez-Ruzafa et al.