

with North Atlantic locations on the second axis, Pacific countries on the positive
part of the first axis, and Southern Atlantic, and Southern Pacific countries as a
transition between the two main groups. The first axis, which determines the
separation of Atlantic and Pacific faunas and the gradient throughout the Magellan
region explain 29.6 % of total variance. The second axis explains only an additional 3.8 % (Fig. 16.10a).
The species represented in Fig. 16.10b are those that have a weight on the axis
higher than 40 %. The positive part of axis 1 is represented by species exclusive to
the Pacific and with a wide distribution in this ocean, like the sea urchins Toxopneustes roseus, Diadema mexicanum Echinometra vanbrunti, Eucidaris thouarsii, Tripneustes depressus, the sea stars Nidorellia armata, Ophidiaster
alexandri, Phataria unifascialis, the ophiuroids Ophiocoma aethiops and the holothuroids Holothuria (Halodeima) kefersteini, Holothuria (Platyperona) difficilis,
Isostichopus fuscus.
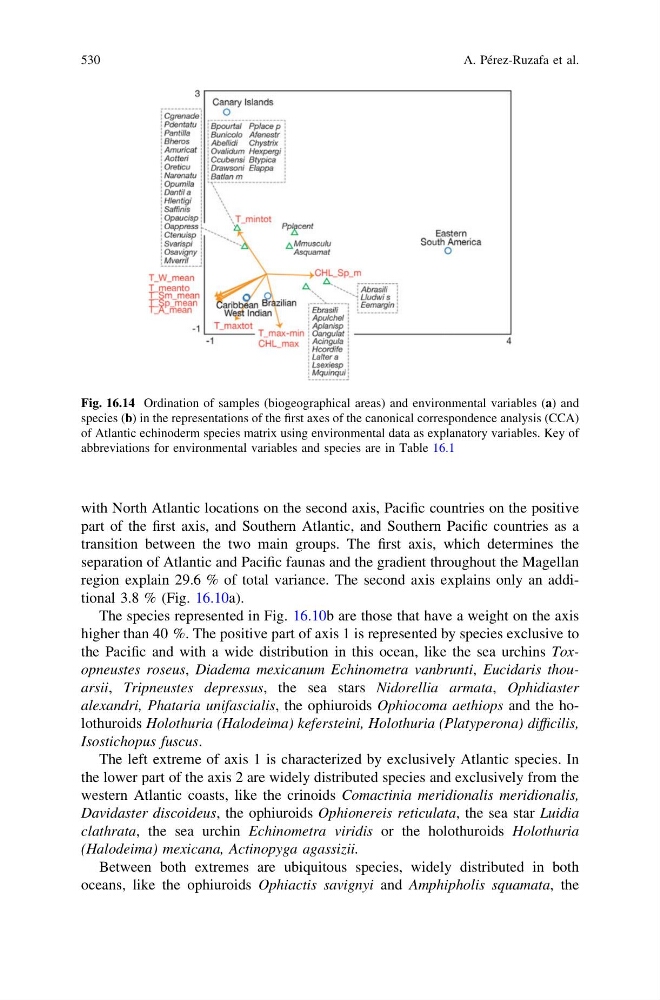
The left extreme of axis 1 is characterized by exclusively Atlantic species. In
the lower part of the axis 2 are widely distributed species and exclusively from the
western Atlantic coasts, like the crinoids Comactinia meridionalis meridionalis,
Davidaster discoideus, the ophiuroids Ophionereis reticulata, the sea star Luidia
clathrata, the sea urchin Echinometra viridis or the holothuroids Holothuria
(Halodeima) mexicana, Actinopyga agassizii.
Between both extremes are ubiquitous species, widely distributed in both
oceans, like the ophiuroids Ophiactis savignyi and Amphipholis squamata, the
Fig. 16.14 Ordination of samples (biogeographical areas) and environmental variables (a) and
species (b) in the representations of the first axes of the canonical correspondence analysis (CCA)
of Atlantic echinoderm species matrix using environmental data as explanatory variables. Key of
abbreviations for environmental variables and species are in Table 16.1
530
A. Pérez-Ruzafa et al.
part of the first axis, and Southern Atlantic, and Southern Pacific countries as a
transition between the two main groups. The first axis, which determines the
separation of Atlantic and Pacific faunas and the gradient throughout the Magellan
region explain 29.6 % of total variance. The second axis explains only an additional 3.8 % (Fig. 16.10a).
The species represented in Fig. 16.10b are those that have a weight on the axis
higher than 40 %. The positive part of axis 1 is represented by species exclusive to
the Pacific and with a wide distribution in this ocean, like the sea urchins Toxopneustes roseus, Diadema mexicanum Echinometra vanbrunti, Eucidaris thouarsii, Tripneustes depressus, the sea stars Nidorellia armata, Ophidiaster
alexandri, Phataria unifascialis, the ophiuroids Ophiocoma aethiops and the holothuroids Holothuria (Halodeima) kefersteini, Holothuria (Platyperona) difficilis,
Isostichopus fuscus.
The left extreme of axis 1 is characterized by exclusively Atlantic species. In
the lower part of the axis 2 are widely distributed species and exclusively from the
western Atlantic coasts, like the crinoids Comactinia meridionalis meridionalis,
Davidaster discoideus, the ophiuroids Ophionereis reticulata, the sea star Luidia
clathrata, the sea urchin Echinometra viridis or the holothuroids Holothuria
(Halodeima) mexicana, Actinopyga agassizii.
Between both extremes are ubiquitous species, widely distributed in both
oceans, like the ophiuroids Ophiactis savignyi and Amphipholis squamata, the
Fig. 16.14 Ordination of samples (biogeographical areas) and environmental variables (a) and
species (b) in the representations of the first axes of the canonical correspondence analysis (CCA)
of Atlantic echinoderm species matrix using environmental data as explanatory variables. Key of
abbreviations for environmental variables and species are in Table 16.1
530
A. Pérez-Ruzafa et al.