

3.3. TwO-DIMENSIONAL MORPHOLOGICAL ANALYSIS OF RANGES OF GROWTH FORMS
83
1.40
1·4 0
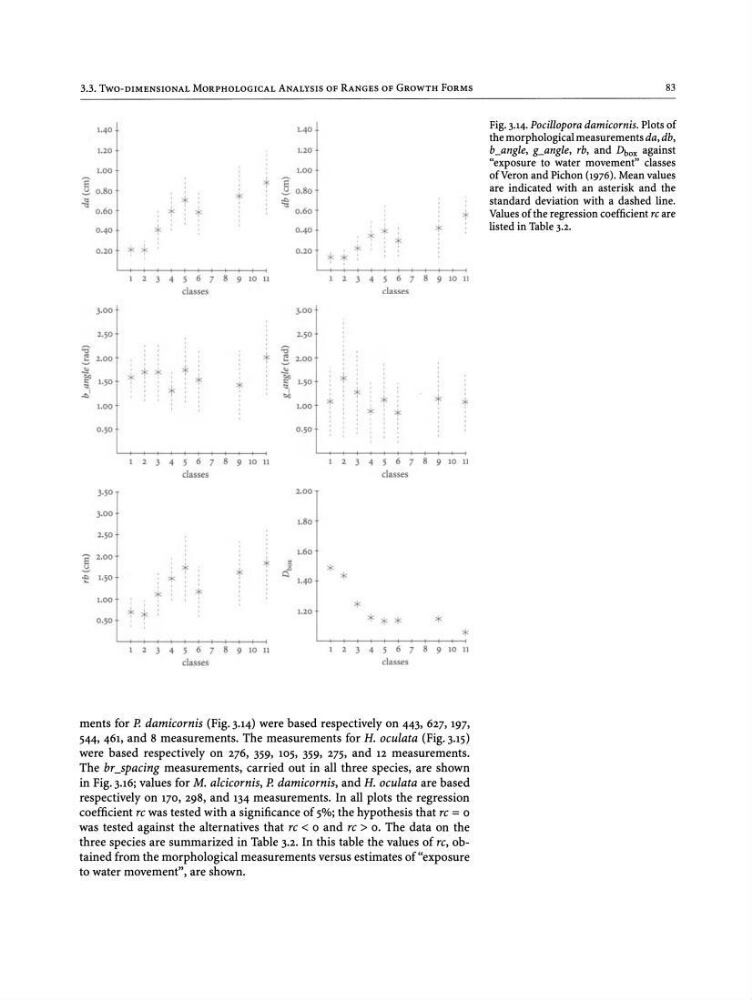
Fig. 3.14. Pocillopora damicornis . Plots of
the morphological measurements da, db,
1.20
1.20
b_angle , g_angle, rb, and ~ox against
1.00
1.0 0
"exposure to water movement" classes
E
:+: E
of Veron and Pichon (1976). Mean values
~ 0.80
~ 0. 80
are indicated with an asterisk and the
<:
~
*
"' "
standard deviation with a dashed line.
"' "
"' "
0 .60
x
*'
0. 60
:+:
Values of the regression coefficient rc are
0 ·4 0
0 ·40
, x
'I"
listed in Table 3.2.
1~
t
0.20
x :+:
0 .20
*
of: ~
I
2 3 4 5 6 7 8 9 10 11
I
2 3 4 5 6 7 8 9 10 11
classes
classes
3·0 0
3·00
2·50
2·50
::;
::;
.; 2.00
.; 2.0 0
,
'"
~
't'
'"
~
' "
"
~
*
<: 1·50
*'
~
~
1·50
,:,1
*
x
I
:+:
' "
1.00
1.00
*
~
0 ·50
0.50
I
2 3 4 5 6 7 8 9 10 11
I
2 3 4 5 6 7 8 9 10 11
classes
classe s
3·50
2.00
3·00
1.8 0
2·50
E
2.00
1.6 0
f
*'
.&
~
~
x
Cl
*
i: 1.50
*
1.4 0
x
*
1.00
*
*
1.20
0 ·50
I
* *
X
*
I
2 3 4 5 6 7 8 9 10 11
I
2 3 4 5 6 7 8 9 10 11
classe s
classes
ments for P. damieornis (Fig. 3.14) were based respectively on 443, 627, 197,
544,461, and 8 measurements. The measurements for H. oeulata (Fig. 3.15)
were based respectively on 276, 359, 105, 359, 275, and 12 measurements.
The br_spacing measurements, carried out in all three species, are shown
in Fig. 3.16; values for M. alcieornis, P. damieornis, and H. oeulata are based
respect ively on 170, 298, and 134 measurements. In all plots the regression
coefficient re was tested with a significance of 5%; the hypothesis that re = 0
was tested against the alternatives that re < 0 and re > o. The data on the
three species are summarized in Table 3.2. In this table the values of re, ob -
tained from the morphological measurements versus estimates of "exposur e
to water movement", are shown.
83
1.40
1·4 0
Fig. 3.14. Pocillopora damicornis . Plots of
the morphological measurements da, db,
1.20
1.20
b_angle , g_angle, rb, and ~ox against
1.00
1.0 0
"exposure to water movement" classes
E
:+: E
of Veron and Pichon (1976). Mean values
~ 0.80
~ 0. 80
are indicated with an asterisk and the
<:
~
*
"' "
standard deviation with a dashed line.
"' "
"' "
0 .60
x
*'
0. 60
:+:
Values of the regression coefficient rc are
0 ·4 0
0 ·40
, x
'I"
listed in Table 3.2.
1~
t
0.20
x :+:
0 .20
*
of: ~
I
2 3 4 5 6 7 8 9 10 11
I
2 3 4 5 6 7 8 9 10 11
classes
classes
3·0 0
3·00
2·50
2·50
::;
::;
.; 2.00
.; 2.0 0
,
'"
~
't'
'"
~
' "
"
~
*
<: 1·50
*'
~
~
1·50
,:,1
*
x
I
:+:
' "
1.00
1.00
*
~
0 ·50
0.50
I
2 3 4 5 6 7 8 9 10 11
I
2 3 4 5 6 7 8 9 10 11
classes
classe s
3·50
2.00
3·00
1.8 0
2·50
E
2.00
1.6 0
f
*'
.&
~
~
x
Cl
*
i: 1.50
*
1.4 0
x
*
1.00
*
*
1.20
0 ·50
I
* *
X
*
I
2 3 4 5 6 7 8 9 10 11
I
2 3 4 5 6 7 8 9 10 11
classe s
classes
ments for P. damieornis (Fig. 3.14) were based respectively on 443, 627, 197,
544,461, and 8 measurements. The measurements for H. oeulata (Fig. 3.15)
were based respectively on 276, 359, 105, 359, 275, and 12 measurements.
The br_spacing measurements, carried out in all three species, are shown
in Fig. 3.16; values for M. alcieornis, P. damieornis, and H. oeulata are based
respect ively on 170, 298, and 134 measurements. In all plots the regression
coefficient re was tested with a significance of 5%; the hypothesis that re = 0
was tested against the alternatives that re < 0 and re > o. The data on the
three species are summarized in Table 3.2. In this table the values of re, ob -
tained from the morphological measurements versus estimates of "exposur e
to water movement", are shown.