

2.2. THE CASE STUDIES
47
Moreover, these phases carry the signatures of characteristic dynamical behavior that can be expressed in terms of frequencies and amplitudes of polyp
and stolon oscillations (Dudgeon et al. 1999).
Food ingested by a polyp elicits oscillatory behavior within 5-15 minutes (phase 1). The elicitor of oscillatory behavior may be either mechanical
strain on polyp tissue associated with ingestion, or the presen ce of nutrients
released from the prey as digestion proceeds. The 5-15 minute delay prior to
the onset of oscillation s is consistent with the hypothesis that nutri ents released from the food trigger polyp contractions. Nevertheless, prey in the
gastric cavity stretches the body column of a polyp laterally and confines oscillatory behavior to only the hypostome. During this phase contractions of
only the hypostome do not generate sufficient pressure to export either fluid
or digested particulates into the stolon .
As the food is broken down into particulates, the constraint on shape
is removed and oscillation s in length increase in amplitude up to a limit
set by the size of the polyp. At this point, length oscillations are of constant
amplitude and presumably of sufficient pressure to export a small volume of
fluid to the stolon as well as a limited exchange of small, digested particul ates
(phase 2). During this second phase , polyp behavior is semi-autonomous
and most of the digestion process occurs in the gastric cavity of the polyp.
Elicitors of polyp oscillations accumulate in the gastric cavity and begin to
be exported into the gastrovascular system.
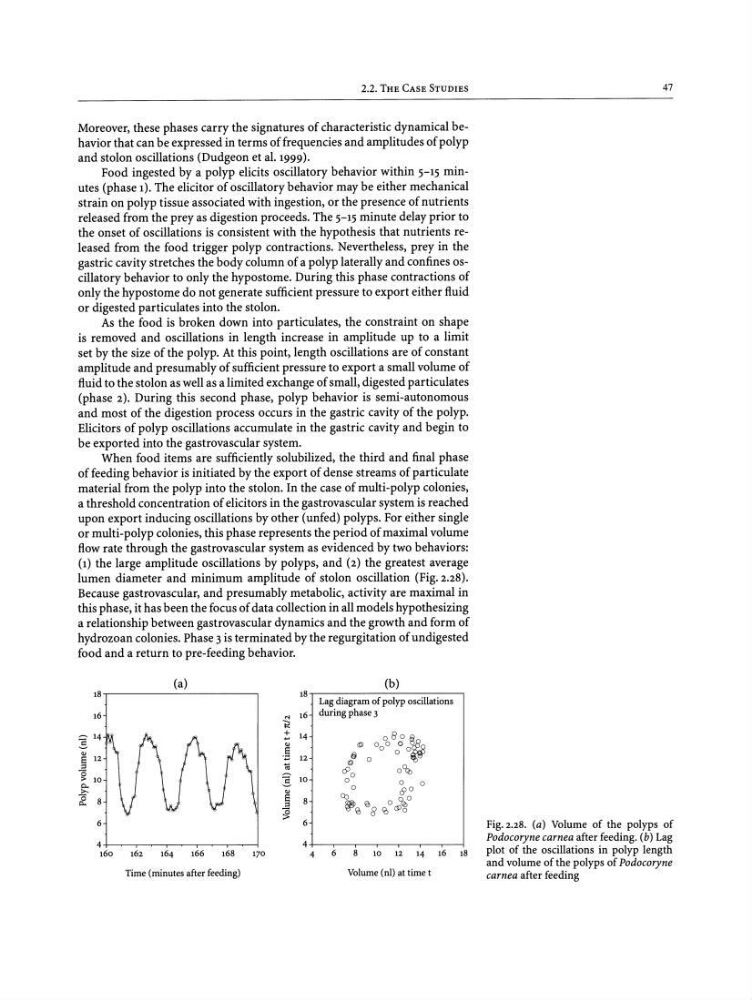
When food items are sufficiently solubilized, the third and final phase
of feeding behavior is initiated by the export of dense streams of particulate
material from the polyp into the stolon . In the case of multi-polyp colonies,
a threshold concentration of elicitor s in the gastrovascular system is reached
upon export inducing oscillations by other (unfed) polyps. For either single
or multi-polyp colonies, this phase represents the per iod of maximal volume
flow rate through the gastrova scular system as evidenced by two behaviors:
(1) the large amplitude oscillations by polyps, and (2) the greatest average
lumen diameter and minimum amplitude of stolon oscillation (Fig. 2.28).
Because gastrovascular, and presumably metabolic , activity are maximal in
this phase , it has been the focus of data collection in all models hypothesizing
a relationship between gastrovascular dynamics and the growth and form of
hydrozoan colonies. Phase 3 is terminated by the regurgitation of und igested
food and a return to pre-feeding behavior.
Fig. 2. 2 8. (a) Volume of the polyps of
Podocoryn e carnea after feeding. (b) Lag
plot of the oscillations in polyp length
and volume of the polyps of Podocory ne
carnea after feeding
Volume (nl) at time t
(b)
6
8
10
12
14
16
18
Lag diag ram of polyp oscillations
during phase 3
18
'"
16
~
+ 14
~
'"
.§ 12
C;j
:510
' "
a 8
..8
e
6
4
170
4
(a)
4 +----r-----,---.---.-~_j
160
162
164
166
168
Time (minutes afte r feeding)
6
18.--- - - - - - - - - ---,
16
:::::- 14
..5
'"
a 12
.§
> 10
~
0' :: 8
47
Moreover, these phases carry the signatures of characteristic dynamical behavior that can be expressed in terms of frequencies and amplitudes of polyp
and stolon oscillations (Dudgeon et al. 1999).
Food ingested by a polyp elicits oscillatory behavior within 5-15 minutes (phase 1). The elicitor of oscillatory behavior may be either mechanical
strain on polyp tissue associated with ingestion, or the presen ce of nutrients
released from the prey as digestion proceeds. The 5-15 minute delay prior to
the onset of oscillation s is consistent with the hypothesis that nutri ents released from the food trigger polyp contractions. Nevertheless, prey in the
gastric cavity stretches the body column of a polyp laterally and confines oscillatory behavior to only the hypostome. During this phase contractions of
only the hypostome do not generate sufficient pressure to export either fluid
or digested particulates into the stolon .
As the food is broken down into particulates, the constraint on shape
is removed and oscillation s in length increase in amplitude up to a limit
set by the size of the polyp. At this point, length oscillations are of constant
amplitude and presumably of sufficient pressure to export a small volume of
fluid to the stolon as well as a limited exchange of small, digested particul ates
(phase 2). During this second phase , polyp behavior is semi-autonomous
and most of the digestion process occurs in the gastric cavity of the polyp.
Elicitors of polyp oscillations accumulate in the gastric cavity and begin to
be exported into the gastrovascular system.
When food items are sufficiently solubilized, the third and final phase
of feeding behavior is initiated by the export of dense streams of particulate
material from the polyp into the stolon . In the case of multi-polyp colonies,
a threshold concentration of elicitor s in the gastrovascular system is reached
upon export inducing oscillations by other (unfed) polyps. For either single
or multi-polyp colonies, this phase represents the per iod of maximal volume
flow rate through the gastrova scular system as evidenced by two behaviors:
(1) the large amplitude oscillations by polyps, and (2) the greatest average
lumen diameter and minimum amplitude of stolon oscillation (Fig. 2.28).
Because gastrovascular, and presumably metabolic , activity are maximal in
this phase , it has been the focus of data collection in all models hypothesizing
a relationship between gastrovascular dynamics and the growth and form of
hydrozoan colonies. Phase 3 is terminated by the regurgitation of und igested
food and a return to pre-feeding behavior.
Fig. 2. 2 8. (a) Volume of the polyps of
Podocoryn e carnea after feeding. (b) Lag
plot of the oscillations in polyp length
and volume of the polyps of Podocory ne
carnea after feeding
Volume (nl) at time t
(b)
6
8
10
12
14
16
18
Lag diag ram of polyp oscillations
during phase 3
18
'"
16
~
+ 14
~
'"
.§ 12
C;j
:510
' "
a 8
..8
e
6
4
170
4
(a)
4 +----r-----,---.---.-~_j
160
162
164
166
168
Time (minutes afte r feeding)
6
18.--- - - - - - - - - ---,
16
:::::- 14
..5
'"
a 12
.§
> 10
~
0' :: 8