

4.7. GASTROVASCULAR DYNAMICS OF HYDRACTINIID HYDROZOANS
The first two equations represent inputs to the polyp . It is not necessary
to provide the mathematical details of the functions is and in, except that it
is required that the amount of nutrient n, increases from zero after feeding,
reaches a plateau when a steady state between production and metabolism of
n is reached, and subsequently declines when the food source is depleted. The
function is represents the amount of solid food substance, s, remaining in the
polyp, given a monotonic decrease, after time t, and u represents the number
of food items fed to the polyp. In the function in, n represents nutrients available to the polyp. The function determines the net rate of nutrient generation:
the difference between the rate at which nutrients are generated by the digestion of solid food and the rate at which they are metabolized or exported by
the polyp . The time course of n starts at t = 0 at the time of feeding, rises as
digestion commences, reaches a plateau when a balance between production
and utilization is reached, and subsequently declines towards 0 as the food
source is depleted. The dynamics of the nutrients, described by the function!n> trigger the polyp oscillations modeled by the function g. In g the two
state variables of the polyp, x and y, represent an underlying nonlinear oscillator whose action is sensitive to n. The oscillations of x and yare reflected
in corresponding oscillations in polyp length (or volume). Such a model is
in accord with qualitative aspects of polyp behavior, including the rise in oscillation amplitude and increase in polyp length shortly after ingestion and
the observation that polyps eventually return to a quiescent state when the
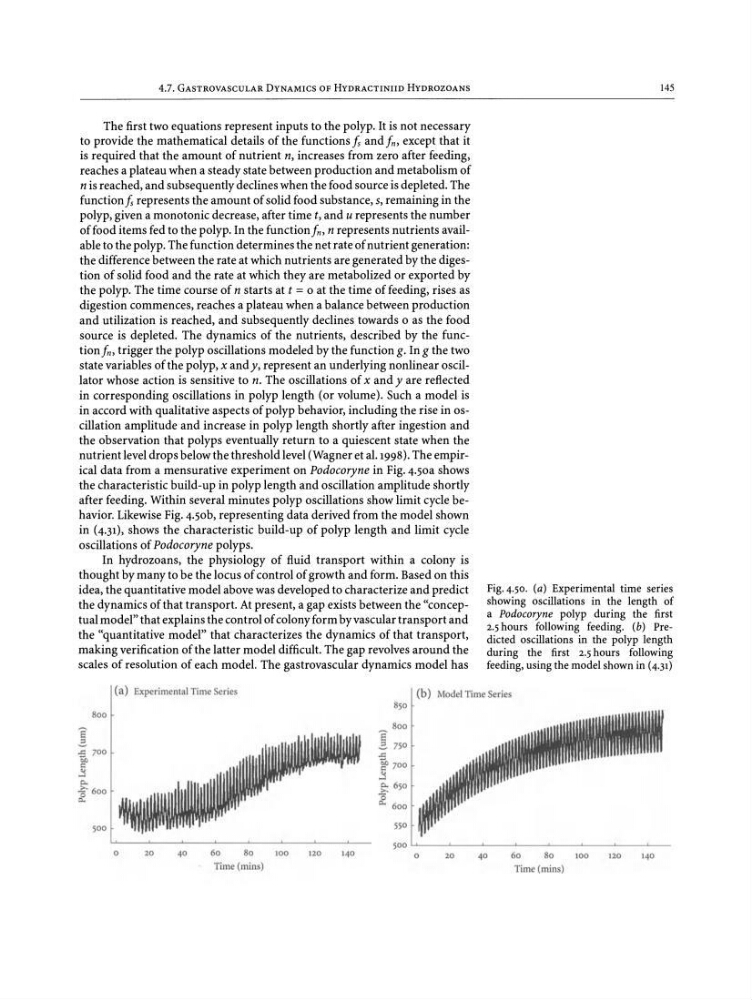
nutrient level drops below the threshold level (Wagner et al. 1998). The empirical data from a mensurative experiment on Podocoryne in Fig. 4.50a shows
the characteristic build-up in polyp length and oscillation amplitude shortly
after feeding. Within several minutes polyp oscillations show limit cycle behavior. Likewise Fig. 4.50b, representing data derived from the model shown
in (4.31), shows the characteristic build-up of polyp length and limit cycle
oscillations of Podocoryne polyps .
In hydrozoans, the physiology of fluid transport within a colony is
thought by many to be the locus of control of growth and form. Based on this
idea, the quantitative model above was developed to characterize and predict
the dynamics of that transport. At present, a gap exists between the "conceptual model" that explains the control of colony form by vascular transport and
the "quantitative model" that characterizes the dynamics of that transport,
making verification of the latter model difficult. The gap revolves around the
scales of resolution of each model. The gastrovascular dynamics model has
145
Fig. 4.50. (a) Experimental time series
showing oscillations in the length of
a Podocoryne polyp during the first
2.5 hours following feeding . (b) Predicted oscillations in the polyp length
during the first 2.5hours following
feeding, using the model shown in (4 .31)
(a) Experimental Time Series
(b) Model Time Series
500 .........- - - ' - - - ' - - - - - ' - - - - ' - - - - - ' - - - - ' - - - - ' - - -
800
E
2..<:: 70 0
e;,
c::
,.:j
c..
1::- 600
:3:
500
o
20
40
60
80
100
Time (mins)
120
140
8 50
800
E
2- 7 50
..<::
~ 700
,.:j
~ 65 0
-0
c, 600
550
o
20
40
60
80
100
Time (mins)
120
140
The first two equations represent inputs to the polyp . It is not necessary
to provide the mathematical details of the functions is and in, except that it
is required that the amount of nutrient n, increases from zero after feeding,
reaches a plateau when a steady state between production and metabolism of
n is reached, and subsequently declines when the food source is depleted. The
function is represents the amount of solid food substance, s, remaining in the
polyp, given a monotonic decrease, after time t, and u represents the number
of food items fed to the polyp. In the function in, n represents nutrients available to the polyp. The function determines the net rate of nutrient generation:
the difference between the rate at which nutrients are generated by the digestion of solid food and the rate at which they are metabolized or exported by
the polyp . The time course of n starts at t = 0 at the time of feeding, rises as
digestion commences, reaches a plateau when a balance between production
and utilization is reached, and subsequently declines towards 0 as the food
source is depleted. The dynamics of the nutrients, described by the function!n> trigger the polyp oscillations modeled by the function g. In g the two
state variables of the polyp, x and y, represent an underlying nonlinear oscillator whose action is sensitive to n. The oscillations of x and yare reflected
in corresponding oscillations in polyp length (or volume). Such a model is
in accord with qualitative aspects of polyp behavior, including the rise in oscillation amplitude and increase in polyp length shortly after ingestion and
the observation that polyps eventually return to a quiescent state when the
nutrient level drops below the threshold level (Wagner et al. 1998). The empirical data from a mensurative experiment on Podocoryne in Fig. 4.50a shows
the characteristic build-up in polyp length and oscillation amplitude shortly
after feeding. Within several minutes polyp oscillations show limit cycle behavior. Likewise Fig. 4.50b, representing data derived from the model shown
in (4.31), shows the characteristic build-up of polyp length and limit cycle
oscillations of Podocoryne polyps .
In hydrozoans, the physiology of fluid transport within a colony is
thought by many to be the locus of control of growth and form. Based on this
idea, the quantitative model above was developed to characterize and predict
the dynamics of that transport. At present, a gap exists between the "conceptual model" that explains the control of colony form by vascular transport and
the "quantitative model" that characterizes the dynamics of that transport,
making verification of the latter model difficult. The gap revolves around the
scales of resolution of each model. The gastrovascular dynamics model has
145
Fig. 4.50. (a) Experimental time series
showing oscillations in the length of
a Podocoryne polyp during the first
2.5 hours following feeding . (b) Predicted oscillations in the polyp length
during the first 2.5hours following
feeding, using the model shown in (4 .31)
(a) Experimental Time Series
(b) Model Time Series
500 .........- - - ' - - - ' - - - - - ' - - - - ' - - - - - ' - - - - ' - - - - ' - - -
800
E
2..<:: 70 0
e;,
c::
,.:j
c..
1::- 600
:3:
500
o
20
40
60
80
100
Time (mins)
120
140
8 50
800
E
2- 7 50
..<::
~ 700
,.:j
~ 65 0
-0
c, 600
550
o
20
40
60
80
100
Time (mins)
120
140